38:
232:
325:
88:
279:
192:
64:
60:
56:
52:
48:
42:
73:
121:
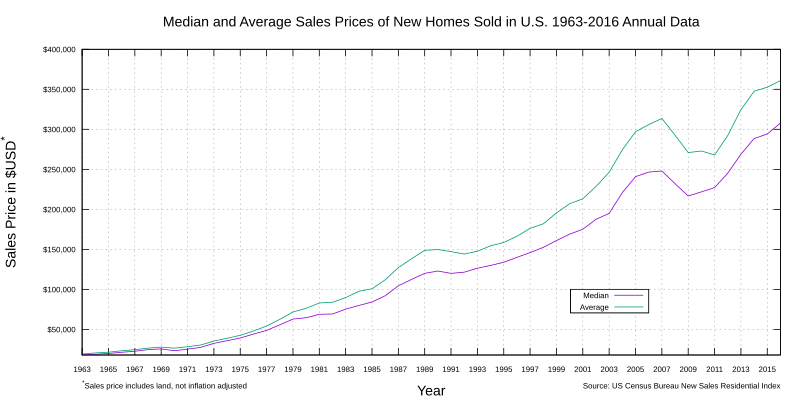
A graph showing the "Median and
Average Sales Prices of New Homes Sold in United States". It shows the annual data from 1963 through 2016. It should be noted that the sales price includes the land. This graph is made using the data from
202:
99:
324:
319:
382:
444:
164:
278:
273:
37:
231:
377:
393:
This file contains additional information, probably added from the digital camera or scanner used to create or digitize it.
301:
356:
347:
198:
396:
If the file has been modified from its original state, some details may not fully reflect the modified file.
310:
297:
135:
123:
343:
438:
207:
289:
335:
201:
employee, taken or made as part of that person's official duties. As a
246:
Click on a date/time to view the file as it appeared at that time.
87:
186:
95:
136:
https://www.census.gov/construction/nrs/pdf/uspriceann.pdf
124:
https://www.census.gov/construction/nrs/pdf/uspriceann.pdf
78:(SVG file, nominally 1,024 × 512 pixels, file size: 42 KB)
383:Timeline of the 2000s United States housing bubble
8:
41:Size of this PNG preview of this SVG file:
398:
248:
110:
424:
416:
408:
400:
375:
373:The following 2 pages use this file:
355:Uploading a public-domain item using
309:fix // Editing SVG source code using
191:
7:
413:Produced by GNUPLOT 5.0 patchlevel 3
203:work of the U.S. federal government
445:United States Census Bureau images
391:
83:
71:
230:
190:
86:
21:
365:You cannot overwrite this file.
14:
26:
1:
31:
199:United States Census Bureau
461:
378:2007–2008 financial crisis
197:This image is a work of a
159:
149:
142:
130:
116:
16:
311:c:User:Rillke/SVGedit.js
94:The source code of this
354:
308:
274:10:37, 25 November 2023
320:22:42, 17 January 2018
205:, the image is in the
211:in the United States.
65:2,560 × 1,280 pixels
113:
47:Other resolutions:
357:File Upload Wizard
111:
61:1,280 × 640 pixels
57:1,024 × 512 pixels
433:
432:
361:
238:
237:
180:
179:
168:
165:Reusing this file
154:US Census Bureau
112:File information
452:
399:
352:
351:
332:
306:
305:
286:
234:
225:
222:
219:
216:
194:
193:
187:
162:
114:
103:
92:
90:
79:
68:
53:640 × 320 pixels
49:320 × 160 pixels
43:800 × 400 pixels
460:
459:
455:
454:
453:
451:
450:
449:
435:
434:
387:
367:
362:
341:
340:
338:
330:
295:
294:
292:
284:
240:
239:
227:
223:
220:
217:
214:
185:
175:
161:
109:
93:
85:
81:
77:
70:
69:
46:
12:
11:
5:
458:
456:
448:
447:
437:
436:
431:
430:
427:
423:
422:
419:
415:
414:
411:
407:
406:
403:
390:
386:
385:
380:
371:
370:
363:
360:
359:
353:
336:
333:
327:
322:
317:
314:
313:
307:
290:
287:
281:
276:
271:
267:
266:
263:
260:
257:
254:
251:
244:
243:
236:
235:
228:
212:
195:
184:
181:
178:
177:
169:
157:
156:
151:
147:
146:
144:
140:
139:
132:
128:
127:
118:
108:
105:
82:
40:
36:
35:
34:
29:
24:
19:
13:
10:
9:
6:
4:
3:
2:
457:
446:
443:
442:
440:
428:
425:
420:
417:
412:
409:
404:
401:
397:
394:
388:
384:
381:
379:
376:
374:
368:
366:
358:
349:
345:
339:
334:
328:
326:
323:
321:
318:
316:
315:
312:
303:
299:
293:
288:
282:
280:
277:
275:
272:
269:
268:
264:
261:
258:
255:
252:
250:
249:
247:
241:
233:
229:
226:
218:Public domain
210:
209:
208:public domain
204:
200:
196:
189:
188:
182:
176:
173:
170:
166:
158:
155:
152:
148:
145:
141:
138:
137:
133:
129:
126:
125:
119:
115:
106:
104:
101:
97:
89:
80:
75:
74:Original file
66:
62:
58:
54:
50:
44:
39:
33:
30:
28:
25:
23:
20:
18:
15:
395:
392:
372:
364:
329:1,024 × 512
283:1,024 × 512
245:
242:File history
213:
206:
174:
171:
153:
134:
120:
117:Description
84:
72:
22:File history
410:Image title
402:Short title
172:See below.
369:File usage
259:Dimensions
160:Permission
27:File usage
256:Thumbnail
253:Date/Time
183:Licensing
439:Category
389:Metadata
348:contribs
302:contribs
32:Metadata
405:Gnuplot
331:(42 KB)
291:Minorax
285:(42 KB)
270:current
265:Comment
150:Author
131:Source
107:Summary
76:
426:Height
418:Width
337:Ninel
224:false
221:false
143:Date
100:valid
421:1024
344:talk
298:talk
262:User
17:File
429:512
98:is
96:SVG
441::
346:|
300:|
215:PD
63:|
59:|
55:|
51:|
45:.
350:)
342:(
304:)
296:(
167:)
163:(
102:.
91:✓
67:.
Text is available under the Creative Commons Attribution-ShareAlike License. Additional terms may apply.


