17:
183:
78:
64:
of the same quantity. The Jones diagram therefore represents four variables. Each quadrant shares the vertical axis with its horizontal neighbor, and the horizontal axis with the vertical neighbor. For example, the top left quadrant shares its vertical axis with the top right quadrant, and the
165:
110:
The Jones diagram concept can be used for variables that depend successively on each other. Jones's original diagram used eleven quadrants to show all the elements of his photographic system.
107:, etc.) to determine the relationship between the light a viewer would see at the time a photo was taken to the light that a viewer would see looking at the finished photograph.
60:. In a Jones diagram opposite directions of an axis represent different quantities, unlike in a Cartesian graph where they represent positive or negative
220:
141:
239:
16:
36:
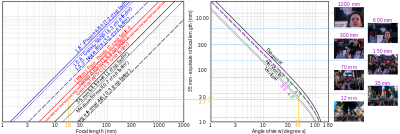
via its effective focal length – for example, the yellow line shows that 18 mm on 3:2 APS-C is equivalent to 27 mm
49:
249:
163:, Bohan, et al., "Method and apparatus for automatically calibrating a CRT display", issued 1994-12-06
66:
213:
57:
160:
206:
104:
61:
153:
244:
137:
100:
96:
83:"a graphical illustration of a Jones Diagram for calibrating user specified tone reproduction
77:
84:
190:
182:
233:
53:
29:
20:
Two-quadrant analogue of a Jones diagram showing the relationship between a camera's
37:
33:
21:
65:
horizontal axis with the bottom left quadrant. The overall system response is in
119:
92:
25:
95:, specifically in displaying sensitivity to light with what are also called "
99:
diagrams". These diagrams are used in the design of photographic systems (
69:
I; the variables that contribute to it are in quadrants II through IV.
194:
56:
in the 1940s, where each axis represents a different
154:Example of a motion-picture film Jones diagram
214:
91:A common application of Jones diagrams is in
40:and yields a vertical angle of 48°, and so on
8:
221:
207:
76:
15:
189:This photography-related article is a
7:
179:
177:
132:Walls, H. J. & Attridge, G. G.
81:FIG. 1 from U.S. Patent 6,484,631.
14:
136:London: Focal Press Ltd., 1977.
181:
158:Example of a CRT Jones diagram:
1:
73:Jones diagrams in photography
193:. You can help Knowledge by
122:– similar diagram technique
266:
176:
240:Science of photography
88:
41:
161:US patent 5371537
80:
19:
134:Basic Photo Science.
89:
42:
250:Photography stubs
202:
201:
97:tone reproduction
257:
223:
216:
209:
185:
178:
169:
168:
164:
265:
264:
260:
259:
258:
256:
255:
254:
230:
229:
228:
227:
174:
166:
159:
150:
129:
116:
82:
75:
50:Cartesian graph
12:
11:
5:
263:
261:
253:
252:
247:
242:
232:
231:
226:
225:
218:
211:
203:
200:
199:
186:
172:
171:
156:
149:
148:External links
146:
145:
144:
128:
125:
124:
123:
115:
112:
74:
71:
30:angles of view
13:
10:
9:
6:
4:
3:
2:
262:
251:
248:
246:
243:
241:
238:
237:
235:
224:
219:
217:
212:
210:
205:
204:
198:
196:
192:
187:
184:
180:
175:
162:
157:
155:
152:
151:
147:
143:
142:0-240-50945-5
139:
135:
131:
130:
126:
121:
118:
117:
113:
111:
108:
106:
102:
98:
94:
86:
79:
72:
70:
68:
63:
59:
55:
54:Loyd A. Jones
52:developed by
51:
48:is a type of
47:
46:Jones diagram
39:
35:
34:aspect ratios
31:
27:
23:
18:
195:expanding it
188:
173:
133:
109:
90:
45:
43:
22:focal length
120:Cobweb plot
93:photography
26:crop factor
234:Categories
127:References
38:full-frame
245:Diagrams
114:See also
67:quadrant
58:variable
32:for two
167:
140:
87:(TRC)"
105:paper
85:curve
62:signs
191:stub
138:ISBN
101:film
28:and
236::
103:,
44:A
24:,
222:e
215:t
208:v
197:.
170:.
Text is available under the Creative Commons Attribution-ShareAlike License. Additional terms may apply.