Main article: 1995 United Kingdom local elections
| |||||||||||||||||||||||||||||||||||||||||||||||||||||
22 of 66 seats (One Third) to Wirral Metropolitan Borough Council 34 seats needed for a majority | |||||||||||||||||||||||||||||||||||||||||||||||||||||
|---|---|---|---|---|---|---|---|---|---|---|---|---|---|---|---|---|---|---|---|---|---|---|---|---|---|---|---|---|---|---|---|---|---|---|---|---|---|---|---|---|---|---|---|---|---|---|---|---|---|---|---|---|---|
| Turnout | 38.2% ( | ||||||||||||||||||||||||||||||||||||||||||||||||||||
| |||||||||||||||||||||||||||||||||||||||||||||||||||||
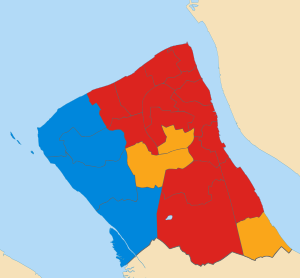 Map of results of 1995 election | |||||||||||||||||||||||||||||||||||||||||||||||||||||
| |||||||||||||||||||||||||||||||||||||||||||||||||||||

The 1995 Wirral Metropolitan Borough Council election took place on 4 May 1995 to elect members of Wirral Metropolitan Borough Council in England. This election was held on the same day as other local elections.
After the election, the composition of the council was:
| Party | Seats | ± | |
|---|---|---|---|
| Labour | 36 | ||
| Conservative | 22 | ||
| Liberal Democrats | 8 | ||
Election results
Overall election result
Overall result compared with 1994.
| Wirral Metropolitan Borough Council election results, 1995 | |||||||||||||||
|---|---|---|---|---|---|---|---|---|---|---|---|---|---|---|---|
| Party | Candidates | Votes | |||||||||||||
| Stood | Elected | Gained | Unseated | Net | % of total | % | No. | Net % | |||||||
| Labour | 22 | 15 | 6 | 0 | 68.2 | 53.5 | 51,052 | ||||||||
| Conservative | 21 | 4 | 0 | 6 | 18.2 | 25.8 | 24,550 | ||||||||
| Liberal Democrats | 22 | 3 | 1 | 1 | 13.6 | 20.1 | 19,179 | ||||||||
| Green | 6 | 0 | 0 | 0 | 0.0 | 0.6 | 558 | ||||||||
Ward results
Bebington
| Party | Candidate | Votes | % | ±% | |
|---|---|---|---|---|---|
| Labour | Patrick Smith | 2,685 | 52.6 | ||
| Conservative | Hilary Jones | 2,045 | 40.1 | ||
| Liberal Democrats | Kevin Turner | 375 | 7.3 | ||
| Majority | 640 | 12.5 | |||
| Registered electors | 10,735 | ||||
| Turnout | 47.6 | ||||
| Labour gain from Conservative | Swing | ||||
Bidston
| Party | Candidate | Votes | % | ±% | |
|---|---|---|---|---|---|
| Labour | Harry Smith | 2,401 | 90.6 | ||
| Liberal Democrats | John Tomlinson | 128 | 4.8 | ||
| Conservative | P. Weare | 121 | 4.6 | ||
| Majority | 2,273 | 85.8 | |||
| Registered electors | 8,446 | ||||
| Turnout | 31.4 | ||||
| Labour hold | Swing | ||||
Birkenhead
| Party | Candidate | Votes | % | ±% | |
|---|---|---|---|---|---|
| Labour | Phillip Davies | 2,850 | 88.3 | ||
| Liberal Democrats | P. Cooke | 196 | 6.1 | ||
| Conservative | B. Brassey | 183 | 5.7 | ||
| Majority | 2,654 | 82.2 | |||
| Registered electors | 10,508 | ||||
| Turnout | 30.7 | ||||
| Labour hold | Swing | ||||
Bromborough
| Party | Candidate | Votes | % | ±% | |
|---|---|---|---|---|---|
| Labour | R. Mullins | 2,950 | 73.2 | ||
| Conservative | K. Roberts | 653 | 16.2 | ||
| Liberal Democrats | M. Bolton | 427 | 10.6 | ||
| Majority | 2,297 | 57.0 | |||
| Registered electors | 11,102 | ||||
| Turnout | 36.3 | ||||
| Labour hold | Swing | ||||
Clatterbridge
| Party | Candidate | Votes | % | ±% | |
|---|---|---|---|---|---|
| Labour | Audrey Moore | 2,486 | 42.8 | ||
| Conservative | Leonard Moore | 2,201 | 37.9 | ||
| Liberal Democrats | W. Walsh | 1,119 | 19.3 | ||
| Majority | 285 | 4.9 | N/A | ||
| Registered electors | 13,974 | ||||
| Turnout | 41.5 | ||||
| Labour gain from Conservative | Swing | ||||
Claughton
| Party | Candidate | Votes | % | ±% | |
|---|---|---|---|---|---|
| Labour | Andrew Day | 2,205 | 49.8 | ||
| Liberal Democrats | Stuart Kelly | 1,644 | 37.1 | ||
| Conservative | P. Greening-Jackson | 509 | 11.5 | ||
| Green | K. Cuthbertson | 73 | 1.6 | New | |
| Majority | 561 | 12.7 | |||
| Registered electors | 10,607 | ||||
| Turnout | 41.8 | ||||
| Labour gain from Liberal Democrats | Swing | ||||
Eastham
| Party | Candidate | Votes | % | ±% | |
|---|---|---|---|---|---|
| Liberal Democrats | George Mitchell | 2,782 | 58.8 | ||
| Labour | A. Sheppard | 1,407 | 29.8 | ||
| Conservative | D. Jones | 539 | 11.4 | ||
| Majority | 1,375 | 29.1 | |||
| Registered electors | 11,345 | ||||
| Turnout | 41.7 | ||||
| Liberal Democrats hold | Swing | ||||
Egerton
| Party | Candidate | Votes | % | ±% | |
|---|---|---|---|---|---|
| Labour | Walter Smith | 2,884 | 76.8 | ||
| Conservative | M. Vickers | 461 | 12.3 | ||
| Liberal Democrats | D. Roberts | 327 | 8.7 | ||
| Green | Joyce Hogg | 82 | 2.2 | New | |
| Majority | 2,423 | 64.5 | |||
| Registered electors | 10,832 | ||||
| Turnout | 34.7 | ||||
| Labour hold | Swing | ||||
Heswall
| Party | Candidate | Votes | % | ±% | |
|---|---|---|---|---|---|
| Conservative | Peter Johnson | 2,874 | 56.0 | ||
| Labour | L. Flanagan | 1,244 | 24.3 | ||
| Liberal Democrats | Edward Norton | 1,011 | 19.7 | ||
| Majority | 1,630 | 31.8 | |||
| Registered electors | 13,295 | ||||
| Turnout | 38.6 | ||||
| Conservative hold | Swing | ||||
Hoylake
| Party | Candidate | Votes | % | ±% | |
|---|---|---|---|---|---|
| Conservative | John Hale | 2,544 | 53.4 | ||
| Labour | Pauline Cocker | 1,490 | 31.3 | ||
| Liberal Democrats | A. Richards | 731 | 15.3 | ||
| Majority | 1,054 | 22.1 | |||
| Registered electors | 12,544 | ||||
| Turnout | 38.0 | ||||
| Conservative hold | Swing | ||||
Leasowe
| Party | Candidate | Votes | % | ±% | |
|---|---|---|---|---|---|
| Labour | Ernest Prout | 2,641 | 81.9 | ||
| Conservative | H. Tooke | 326 | 10.1 | ||
| Liberal Democrats | Susanne Uriel | 259 | 8.0 | ||
| Majority | 2,315 | 71.8 | |||
| Registered electors | 9,581 | ||||
| Turnout | 33.7 | ||||
| Labour hold | Swing | ||||
Liscard
| Party | Candidate | Votes | % | ±% | |
|---|---|---|---|---|---|
| Labour | John Cocker | 2,985 | 71.9 | ||
| Liberal Democrats | M. Todd | 1,169 | 28.1 | ||
| Majority | 1,816 | 43.7 | |||
| Registered electors | 11,324 | ||||
| Turnout | 36.7 | ||||
| Labour hold | Swing | ||||
Moreton
| Party | Candidate | Votes | % | ±% | |
|---|---|---|---|---|---|
| Labour | Margaret Green | 2,534 | 58.4 | ||
| Conservative | Ann Dishman | 1,506 | 34.7 | ||
| Liberal Democrats | C. Robertson | 300 | 6.9 | ||
| Majority | 1,028 | 23.7 | |||
| Registered electors | 9,662 | ||||
| Turnout | 44.9 | ||||
| Labour gain from Conservative | Swing | ||||
New Brighton
| Party | Candidate | Votes | % | ±% | |
|---|---|---|---|---|---|
| Labour | Mike Keenan | 2,608 | 62.4 | ||
| Conservative | Vera Ruck | 1,042 | 24.9 | ||
| Liberal Democrats | John Codling | 531 | 12.7 | ||
| Majority | 1,566 | 35.7 | |||
| Registered electors | 11,563 | ||||
| Turnout | 36.2 | ||||
| Labour gain from Conservative | Swing | ||||
Oxton
| Party | Candidate | Votes | % | ±% | |
|---|---|---|---|---|---|
| Liberal Democrats | Patricia Williams | 2,473 | 53.3 | ||
| Labour | Denis Knowles | 1,428 | 30.8 | ||
| Conservative | Cyrus Ferguson | 655 | 14.1 | ||
| Green | Garnette Bowler | 80 | 1.7 | New | |
| Majority | 1,045 | 22.5 | |||
| Registered electors | 11,613 | ||||
| Turnout | 39.9 | ||||
| Liberal Democrats hold | Swing | ||||
Prenton
| Party | Candidate | Votes | % | ±% | |
|---|---|---|---|---|---|
| Liberal Democrats | Edward Cunniffe | 2,360 | 46.2 | ||
| Labour | Keith Williams | 1,828 | 35.8 | ||
| Conservative | A. Adams | 919 | 18.0 | ||
| Majority | 532 | 10.4 | |||
| Registered electors | 11,752 | ||||
| Turnout | 43.5 | ||||
| Liberal Democrats gain from Conservative | Swing | ||||
Royden
| Party | Candidate | Votes | % | ±% | |
|---|---|---|---|---|---|
| Conservative | C. Kevan | 2,161 | 45.4 | ||
| Labour | R. Pennington | 1,534 | 32.3 | ||
| Liberal Democrats | Peter Reisdorf | 952 | 20.0 | ||
| Green | Cecil Bowler | 108 | 2.3 | New | |
| Majority | 627 | 13.2 | |||
| Registered electors | 12,638 | ||||
| Turnout | 37.6 | ||||
| Conservative hold | Swing | ||||
Seacombe
| Party | Candidate | Votes | % | ±% | |
|---|---|---|---|---|---|
| Labour | Adrian Jones | 3,200 | 83.5 | ||
| Conservative | Patricia Jones | 315 | 8.2 | ||
| Liberal Democrats | M. Wright | 219 | 5.7 | ||
| Green | M. Godwin | 99 | 2.6 | New | |
| Majority | 2,885 | 75.3 | |||
| Registered electors | 11,321 | ||||
| Turnout | 33.9 | ||||
| Labour hold | Swing | ||||
Thurstaston
| Party | Candidate | Votes | % | ±% | |
|---|---|---|---|---|---|
| Conservative | Jeffrey Green | 2,084 | 46.2 | ||
| Labour | A. Bell | 1,789 | 39.6 | ||
| Liberal Democrats | Charles Wall | 641 | 14.2 | New | |
| Majority | 295 | 6.5 | |||
| Registered electors | 12,510 | ||||
| Turnout | 36.1 | ||||
| Conservative hold | Swing | ||||
Tranmere
| Party | Candidate | Votes | % | ±% | |
|---|---|---|---|---|---|
| Labour | Christine Meaden | 2,478 | 83.7 | ||
| Conservative | H. Jackson-Payne | 185 | 6.3 | ||
| Liberal Democrats | Stephen Blaylock | 181 | 6.1 | ||
| Green | Nigel Birchenough | 116 | 3.9 | ||
| Majority | 2,293 | 77.5 | |||
| Registered electors | 9,762 | ||||
| Turnout | 30.3 | ||||
| Labour hold | Swing | ||||
Upton
| Party | Candidate | Votes | % | ±% | |
|---|---|---|---|---|---|
| Labour | Peter Corcoran | 3,109 | 64.6 | ||
| Conservative | D. Smith | 1,157 | 24.1 | ||
| Liberal Democrats | E. Davies | 543 | 11.3 | ||
| Majority | 1,952 | 40.6 | |||
| Registered electors | 12,810 | ||||
| Turnout | 37.5 | ||||
| Labour hold | Swing | ||||
Wallasey
| Party | Candidate | Votes | % | ±% | |
|---|---|---|---|---|---|
| Labour | Melanie Iredale | 2,316 | 44.6 | ||
| Conservative | Lesley Rennie | 2,070 | 39.8 | ||
| Liberal Democrats | John Uriel | 811 | 15.6 | ||
| Majority | 246 | 4.7 | N/A | ||
| Registered electors | 11,943 | ||||
| Turnout | 43.5 | ||||
| Labour gain from Conservative | Swing | ||||
Notes
• italics denote the sitting councillor • bold denotes the winning candidate
- Incumbent councillor for New Brighton ward.
- Incumbent councillor for Prenton ward.
References
- ^ "Local Election Summaries 1995". The Elections Centre. Retrieved 17 January 2019.
- ^ "Metropolitan Borough of Wirral Election Results 1973-2012 (Pg. 13)" (PDF). The Elections Centre. Retrieved 17 January 2019.
- "Council compositions". The Elections Centre. Retrieved 27 July 2018.
- "Councillor Tony Smith". Wirral Metropolitan Borough Council.
- "Councillor Harry Smith". Wirral Metropolitan Borough Council.
- "Councillor Phil Davies". Wirral Metropolitan Borough Council. Archived from the original on 12 June 2018. Retrieved 20 January 2019.
- "Councillor Stuart Kelly". Wirral Metropolitan Borough Council. 7 August 2023.
- "Councillor Dave Mitchell". Wirral Metropolitan Borough Council.
- "Councillor Walter Smith". Wirral Metropolitan Borough Council. Archived from the original on 12 June 2018. Retrieved 20 January 2019.
- "Councillor Peter Johnson". Wirral Metropolitan Borough Council.
- "Councillor John Hale". Wirral Metropolitan Borough Council. Archived from the original on 5 July 2018. Retrieved 20 January 2019.
- "Councillor Pat Williams". Wirral Metropolitan Borough Council. Archived from the original on 12 June 2018. Retrieved 20 January 2019.
- "Councillor Denis Knowles". Wirral Metropolitan Borough Council.
- "Councillor Jerry Williams". Wirral Metropolitan Borough Council. 7 August 2023.
- "Councillor Peter Reisdorf". Wirral Metropolitan Borough Council.
- "Councillor Adrian Jones". Wirral Metropolitan Borough Council.
- "Councillor Jeff Green". Wirral Metropolitan Borough Council. 7 August 2023.
- "Councillor Chris Meaden". Wirral Metropolitan Borough Council.
- "Councillor Lesley Rennie". Wirral Metropolitan Borough Council. 7 August 2023.
Mellows-Facer, Adam (10 May 2006). "Local election 2006". parliament.uk. Retrieved 29 December 2018.
"BBC NEWS VOTE 2003 WIRRAL". BBC News. 1 May 2003. Retrieved 29 December 2018.