| |||||||||||||||||||||||||||||||||||||||||||||||||||||||||||
All 51 council seats to Barking and Dagenham London Borough Council 26 seats needed for a majority | |||||||||||||||||||||||||||||||||||||||||||||||||||||||||||
|---|---|---|---|---|---|---|---|---|---|---|---|---|---|---|---|---|---|---|---|---|---|---|---|---|---|---|---|---|---|---|---|---|---|---|---|---|---|---|---|---|---|---|---|---|---|---|---|---|---|---|---|---|---|---|---|---|---|---|---|
| |||||||||||||||||||||||||||||||||||||||||||||||||||||||||||
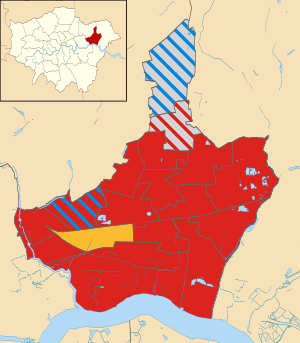 Map of the results of the 2002 Barking and Dagenham council election. Labour in red, Chadwell Heath Residents Association in grey, Liberal Democrats in yellow and Conservatives in blue. | |||||||||||||||||||||||||||||||||||||||||||||||||||||||||||
| |||||||||||||||||||||||||||||||||||||||||||||||||||||||||||
Elections for Barking and Dagenham London Borough Council, UK were held on 2 May 2002 to elect members to the council. All seats were up for election following boundary changes since the last election in 1998. The Labour Party kept overall control of the council, but lost 5 seats. Overall turnout was 22.76%.
Background
100 candidates nominated in total. Labour again ran a full slate (51) and was the only party to do so. By contrast the Conservative Party ran only 12 candidates , whilst the Liberal Democrats ran 28.
Election result
| Party | Seats | Gains | Losses | Net gain/loss | Seats % | Votes % | Votes | +/− | |
|---|---|---|---|---|---|---|---|---|---|
| Labour | 42 | 0 | -2 | -5 | 82.4 | 55.6 | 14,654 | ||
| Liberal Democrats | 3 | 1 | 0 | +2 | 5.9 | 23.2 | 6,115 | ||
| Conservative | 2 | 2 | 0 | +2 | 3.9 | 13.8 | 3,638 | ||
| Chadwell Heath RA | 4 | 0 | -1 | +1 | 7.8 | 5.5 | 1,444 | ||
| Green | 0 | 0 | 0 | ±0.0 | 0.0 | 1.2 | 306 | ||
| Independent | 0 | 0 | 0 | ±0.0 | 0.0 | 0.8 | 210 | ||
- gains and losses do not include the winning of new seats
Ward results
Abbey
| Party | Candidate | Votes | % | ±% | |
|---|---|---|---|---|---|
| Labour | Jeanne Alexander | 997 | 70.1 | −1.1 | |
| Labour | Graham Bramley | 921 | |||
| Labour | Mohammed Fani | 895 | |||
| Liberal Democrats | Brian Beadle | 426 | 29.9 | +1.1 | |
| Liberal Democrats | June Griffin | 387 | |||
| Liberal Democrats | Margaret Tester | 354 | |||
| Turnout | 1,536 | 22.9 | −4.4 | ||
| Registered electors | 3,580 | ||||
| Labour hold | Swing | ||||
| Labour hold | Swing | ||||
| Labour hold | Swing | ||||
Alibon
| Party | Candidate | Votes | % | ±% | |
|---|---|---|---|---|---|
| Labour | Terry Wade | 743 | 67.4 | −5.3 | |
| Labour | John Davis | 724 | |||
| Labour | Mick McCarthy | 632 | |||
| Conservative | Mary Justice | 360 | 32.6 | +19.4 | |
| Turnout | 1,264 | 19.1 | −5.4 | ||
| Registered electors | 6,631 | ||||
| Labour hold | Swing | ||||
| Labour hold | Swing | ||||
| Labour win (new seat) | |||||
Becontree
| Party | Candidate | Votes | % | ±% | |
|---|---|---|---|---|---|
| Labour | Edith Bradley | 841 | 65.8 | −10.0 | |
| Labour | John Wainwright | 686 | |||
| Labour | Cameron Geddes | 684 | |||
| Liberal Democrats | Rosemary Roberts | 438 | 34.2 | +10.0 | |
| Turnout | 1,229 | 17.0 | −2.8 | ||
| Registered electors | 7,212 | ||||
| Labour hold | Swing | ||||
| Labour hold | Swing | ||||
| Labour win (new seat) | |||||
Chadwell Heath
| Party | Candidate | Votes | % | ±% | |
|---|---|---|---|---|---|
| Residents | Ronald Curtis | 682 | 35.6 | −26.6 | |
| Residents | Robert Jeyes | 667 | |||
| Conservative | Terry Justice | 642 | 33.5 | +24.2 | |
| Residents | Donna Lewis | 624 | |||
| Labour | Patricia Northover | 594 | 31.0 | +2.4 | |
| Labour | Abdul Aziz | 513 | |||
| Labour | Alok Agrawal | 485 | |||
| Turnout | 1,827 | 26.7 | −5.0 | ||
| Registered electors | 6,855 | ||||
| Residents hold | Swing | ||||
| Residents hold | Swing | ||||
| Conservative gain from Residents | Swing | ||||
Eastbrook
| Party | Candidate | Votes | % | ±% | |
|---|---|---|---|---|---|
| Labour | Lawrence Bunn | 1,003 | 51.8 | −21.8 | |
| Labour | Leonard Collins | 936 | |||
| Labour | Sidney Summerfield | 893 | |||
| Conservative | Sue Connolly | 725 | 37.4 | N/A | |
| Conservative | Kerry Smith | 717 | |||
| Conservative | Vivian Patten | 677 | |||
| Independent | Mike Butler | 210 | 10.8 | N/A | |
| Turnout | 1,897 | 25.6 | +0.5 | ||
| Registered electors | 7,419 | ||||
| Labour hold | Swing | ||||
| Labour hold | Swing | ||||
| Labour hold | Swing | ||||
Eastbury
| Party | Candidate | Votes | % | ±% | |
|---|---|---|---|---|---|
| Liberal Democrats | Alan Cooper | 986 | 56.4 | +5.3 | |
| Liberal Democrats | Jayne Cooper | 930 | |||
| Liberal Democrats | Daniel Felton | 885 | |||
| Labour | June Arnold | 763 | 43.6 | −5.3 | |
| Labour | Pat Manley | 760 | |||
| Labour | Rocky Gill | 648 | |||
| Turnout | 1,873 | 25.8 | −14.3 | ||
| Registered electors | 7,255 | ||||
| Liberal Democrats hold | Swing | ||||
| Liberal Democrats gain from Labour | Swing | ||||
| Liberal Democrats win (new seat) | |||||
Gascoigne
| Party | Candidate | Votes | % | ±% | |
|---|---|---|---|---|---|
| Labour | Kay Flint | 992 | 64.7 | −12.6 | |
| Labour | Valerie Rush | 863 | |||
| Labour | Milton McKenzie | 857 | |||
| Liberal Democrats | Alan Cornwell | 383 | 25.0 | +2.3 | |
| Liberal Democrats | Bryan Tester | 324 | |||
| Liberal Democrats | Stephen Gower | 317 | |||
| Green | Hidir Yildirim | 158 | 10.3 | N/A | |
| Turnout | 1,474 | 24.2 | +0.8 | ||
| Registered electors | 6,086 | ||||
| Labour hold | Swing | ||||
| Labour hold | Swing | ||||
| Labour hold | Swing | ||||
Goresbrook
| Party | Candidate | Votes | % | ±% | |
|---|---|---|---|---|---|
| Labour | Jeff Porter | 847 | 62.0 | −4.1 | |
| Labour | Matthew Huggins | 842 | |||
| Labour | Alan Thomas | 778 | |||
| Liberal Democrats | Kelly Gill | 520 | 38.0 | +4.1 | |
| Liberal Democrats | William Gill | 509 | |||
| Turnout | 1,443 | 20.3 | −4.2 | ||
| Registered electors | 7,107 | ||||
| Labour hold | Swing | ||||
| Labour hold | Swing | ||||
| Labour win (new seat) | |||||
Heath
| Party | Candidate | Votes | % | ±% | |
|---|---|---|---|---|---|
| Labour | Charles Fairbrass | 966 | 57.6 | +11.4 | |
| Labour | Bryan Osborn | 918 | |||
| Labour | Sidney Kallar | 904 | |||
| Conservative | George Woodward | 362 | 21.6 | +5.7 | |
| Liberal Democrats | Benjamin Whyte | 349 | 20.8 | +5.7 | |
| Liberal Democrats | Antony Stepton | 328 | |||
| Turnout | 1,514 | 21.8 | −1.9 | ||
| Registered electors | 6,951 | ||||
| Labour hold | Swing | ||||
| Labour hold | Swing | ||||
| Labour hold | Swing | ||||
Longbridge
| Party | Candidate | Votes | % | ±% | |
|---|---|---|---|---|---|
| Labour | Sue Bramley | 869 | 42.2 | −15.5 | |
| Labour | Madeleine Baker | 852 | |||
| Conservative | Brian Cook | 811 | 39.4 | N/A | |
| Labour | Nirmal Gill | 774 | |||
| Conservative | Anton Clark | 757 | |||
| Conservative | Paul Cocklind | 741 | |||
| Liberal Democrats | Lea Harding | 379 | 18.4 | −23.9 | |
| Liberal Democrats | Hazel Price | 352 | |||
| Liberal Democrats | Shirley Felton | 334 | |||
| Turnout | 2,115 | 29.6 | −0.6 | ||
| Registered electors | 7,153 | ||||
| Labour hold | Swing | ||||
| Labour hold | Swing | ||||
| Conservative gain from Labour | Swing | ||||
Mayesbrook
| Party | Candidate | Votes | % | ±% | |
|---|---|---|---|---|---|
| Labour | Jean Blake | 648 | 52.4 | N/A | |
| Labour | Dee Hunt | 619 | |||
| Labour | June Conyard | 605 | |||
| Liberal Democrats | John Dias-Broughton | 589 | 47.6 | N/A | |
| Liberal Democrats | Raymond Little | 589 | |||
| Liberal Democrats | Jonathon Lopez-Real | 533 | |||
| Turnout | 1,383 | 20.8 | N/A | ||
| Registered electors | 6,655 | ||||
| Labour win (new seat) | |||||
| Labour win (new seat) | |||||
| Labour win (new seat) | |||||
Parsloes
| Party | Candidate | Votes | % | ±% | |
|---|---|---|---|---|---|
| Labour | Frederick Jones | 775 | 62.7 | −14.5 | |
| Labour | Herbert Collins | 758 | |||
| Labour | Dennis O’Brien | 647 | |||
| Liberal Democrats | Winifred Chapman | 462 | 37.3 | +14.5 | |
| Liberal Democrats | Tony Perry | 446 | |||
| Turnout | 1,295 | 19.9 | −3.6 | ||
| Registered electors | 6,495 | ||||
| Labour hold | Swing | ||||
| Labour hold | Swing | ||||
| Labour win (new seat) | |||||
River
| Party | Candidate | Votes | % | ±% | |
|---|---|---|---|---|---|
| Labour | Liam Smith | 1,018 | 69.4 | −6.5 | |
| Labour | Patricia Twomey | 987 | |||
| Labour | Inder Jamu | 827 | |||
| Liberal Democrats | Rosemary McCulloch | 449 | 30.6 | +6.5 | |
| Turnout | 1,462 | 20.4 | −0.3 | ||
| Registered electors | 7,160 | ||||
| Labour hold | Swing | ||||
| Labour hold | Swing | ||||
| Labour win (new seat) | |||||
Thames
| Party | Candidate | Votes | % | ±% | |
|---|---|---|---|---|---|
| Labour | Fred Barns | 980 | 67.6 | −4.9 | |
| Labour | Joan Rawlinson | 947 | |||
| Labour | David Miles | 940 | |||
| Liberal Democrats | Juan Dias-Broughton | 321 | 22.2 | +16.8 | |
| Liberal Democrats | Mardell Dias | 293 | |||
| Liberal Democrats | Lisa Dias-Broughton | 293 | |||
| Green | Francis Koch-Krause | 148 | 10.2 | N/A | |
| Turnout | 1,457 | 23.7 | −7.1 | ||
| Registered electors | 6,144 | ||||
| Labour hold | Swing | ||||
| Labour hold | Swing | ||||
| Labour win (new seat) | |||||
Valence
| Party | Candidate | Votes | % | ±% | |
|---|---|---|---|---|---|
| Labour | Vera Cridland | 897 | 67.6 | −7.0 | |
| Labour | Jean Bruce | 811 | |||
| Labour | Catherine Osborne | 741 | |||
| Liberal Democrats | Claire Stepton | 430 | 32.4 | +7.0 | |
| Turnout | 1,333 | 20.3 | −1.9 | ||
| Registered electors | 6,568 | ||||
| Labour hold | Swing | ||||
| Labour hold | Swing | ||||
| Labour hold | Swing | ||||
Village
| Party | Candidate | Votes | % | ±% | |
|---|---|---|---|---|---|
| Labour | Lee Waker | 981 | 55.2 | −14.9 | |
| Labour | Darrin Best | 946 | |||
| Labour | Bill Dale | 890 | |||
| Conservative | Neil Connelly | 414 | 23.3 | +6.2 | |
| Liberal Democrats | Frederick Tindling | 383 | 21.5 | +8.7 | |
| Turnout | 1,552 | 22.4 | −1.1 | ||
| Registered electors | 6,941 | ||||
| Labour hold | Swing | ||||
| Labour hold | Swing | ||||
| Labour hold | Swing | ||||
Whalebone
| Party | Candidate | Votes | % | ±% | |
|---|---|---|---|---|---|
| Residents | Albert Gibbs | 762 | 41.7 | N/A | |
| Residents | John Denyer | 755 | |||
| Labour | Marie West | 740 | 40.5 | N/A | |
| Labour | Raymond Parkin | 701 | |||
| Residents | Keith Woodcock | 675 | |||
| Labour | Maureen Worby | 667 | |||
| Conservative | Philip Grimmer | 324 | 17.7 | N/A | |
| Conservative | Sylvia Grimmer | 279 | |||
| Turnout | 1,811 | 26.2 | N/A | ||
| Registered electors | 6,922 | ||||
| Residents win (new seat) | |||||
| Residents win (new seat) | |||||
| Labour win (new seat) | |||||
By-elections between 2002 and 2006
Longbridge
| Party | Candidate | Votes | % | ±% | |
|---|---|---|---|---|---|
| Conservative | Anton Clark | 1,186 | 61.0 | +21.6 | |
| Labour | Simon Bremner | 578 | 29.7 | −12.5 | |
| Liberal Democrats | Jonathan Lopez-Real | 180 | 9.3 | −9.1 | |
| Majority | 608 | 31.3 | N/A | ||
| Turnout | 26.8 | −2.8 | |||
| Registered electors | |||||
| Conservative gain from Labour | Swing | ||||
The by-election was called following the death of Cllr. Susan Bramley.
Eastbrook
| Party | Candidate | Votes | % | ±% | |
|---|---|---|---|---|---|
| Labour | Robert Little | 847 | 47.5 | −4.3 | |
| Labour | Raymond Parkin | 839 | |||
| Conservative | Susan Connelly | 778 | 43.6 | +6.2 | |
| Conservative | Kerry Smith | 768 | |||
| Liberal Democrats | Karen Perry | 110 | 6.7 | +6.7 | |
| Liberal Democrats | Tony Perry | 96 | |||
| Green | Melissa Serpico | 50 | 2.8 | +2.8 | |
| Green | Francis Koch-Krase | 43 | |||
| Majority | 69 | 3.9 | N/A | ||
| Turnout | 24.3 | −1.3 | |||
| Registered electors | |||||
| Labour hold | Swing | ||||
| Labour hold | Swing | ||||
The by-election was called following the death of Cllr. Lawrence Bunn and the resignation of Cllr. Sidney Summerfield.
Eastbury
| Party | Candidate | Votes | % | ±% | |
|---|---|---|---|---|---|
| Liberal Democrats | Diane Challis | 470 | 32.9 | −23.5 | |
| Labour | James McDermott | 466 | 32.6 | −11.0 | |
| Conservative | Colin King | 381 | 26.7 | +26.7 | |
| Green | Geoff Sheridan | 111 | 7.8 | +7.8 | |
| Majority | 4 | 0.3 | N/A | ||
| Turnout | 19.8 | −7.0 | |||
| Registered electors | |||||
| Liberal Democrats hold | Swing | ||||
The by-election was called following the death of Cllr. Daniel Felton
Chadwell Heath
| Party | Candidate | Votes | % | ±% | |
|---|---|---|---|---|---|
| Labour | Nadine Smith | 965 | 39.4 | +8.4 | |
| Conservative | Mary Brigid Justice | 899 | 36.7 | +3.2 | |
| Residents | Elaine Constance Matthews | 468 | 19.1 | −16.5 | |
| Green | Geoff Sheridan | 117 | 4.8 | +4.8 | |
| Majority | 66 | 2.7 | N/A | ||
| Turnout | 35.5 | +8.8 | |||
| Registered electors | |||||
| Labour gain from Residents | Swing | ||||
The by-election was called following the death of Cllr. Robert Jeyes.
Valence
| Party | Candidate | Votes | % | ±% | |
|---|---|---|---|---|---|
| Labour | Donald Hemmett | 761 | 41.6 | −26.0 | |
| BNP | Lawrence Rustem | 576 | 31.5 | +31.5 | |
| Conservative | George Woodward | 279 | 15.3 | +15.3 | |
| Liberal Democrats | Angela Lambart | 148 | 8.1 | −24.3 | |
| Green | Laurence Cleeland | 65 | 3.6 | +3.6 | |
| Majority | 185 | 10.1 | N/A | ||
| Turnout | 27.8 | +7.5 | |||
| Registered electors | |||||
| Labour hold | Swing | ||||
The by-election was called following the death of Cllr. Vera Cridland.
Goresbrook
| Party | Candidate | Votes | % | ±% | |
|---|---|---|---|---|---|
| BNP | Daniel Kelly | 1,072 | 51.9 | N/A | |
| Labour | Patricia Northover | 602 | 29.1 | −32.9 | |
| UKIP | Terence Jones | 137 | 6.6 | N/A | |
| Conservative | Christine Naylor | 111 | 5.4 | N/A | |
| Liberal Democrats | Frederick Tindling | 85 | 4.1 | −33.9 | |
| Green | Geoff Sheridan | 59 | 2.9 | N/A | |
| Majority | 470 | 22.8 | N/A | ||
| Turnout | 28.8 | +8.5 | |||
| Registered electors | |||||
| BNP gain from Labour | Swing | ||||
The by-election was called following the resignation of Cllr. Matthew Huggins.
Village
| Party | Candidate | Votes | % | ±% | |
|---|---|---|---|---|---|
| Labour | Philip Waker | 1,085 | 44.7 | −10.5 | |
| BNP | Lawrence Rustem | 934 | 38.5 | +38.5 | |
| Conservative | Kerry Smith | 410 | 16.9 | −6.4 | |
| Majority | 151 | 6.2 | N/A | ||
| Turnout | 35.0 | +12.6 | |||
| Registered electors | |||||
| Labour hold | Swing | ||||
The by-election was called following the death of Cllr. Darrin Best.
Becontree
| Party | Candidate | Votes | % | ±% | |
|---|---|---|---|---|---|
| Labour | Alok Komar Agrawal | 1,171 | 59.8 | −6.0 | |
| BNP | John Luisis | 378 | 19.3 | +19.3 | |
| Conservative | Anthony Brian Chytry | 283 | 14.4 | +14.4 | |
| UKIP | John Bolton | 125 | 6.4 | +6.4 | |
| Majority | 793 | 40.5 | N/A | ||
| Turnout | 25.9 | +8.9 | |||
| Registered electors | |||||
| Labour hold | Swing | ||||
The by-election was called following the death of Cllr. John Wainwright.
Goresbrook
| Party | Candidate | Votes | % | ±% | |
|---|---|---|---|---|---|
| Labour | Warren Northover | 1,227 | 51.0 | +22.0 | |
| BNP | Lawrence Rustem | 791 | 32.9 | −19.0 | |
| UKIP | Kerry J. Smith | 216 | 9.0 | +2.4 | |
| Conservative | Christine Naylor | 167 | 7.0 | +1.6 | |
| Majority | 436 | 17.1 | N/A | ||
| Turnout | 33.6 | +13.3 | |||
| Registered electors | |||||
| Labour gain from BNP | Swing | ||||
The by-election was called following the resignation of Cllr. Daniel Kelly.
References
- ^ "London Borough Council Elections 2 May 2002". London Datastore. London Residuary Body. Retrieved 25 May 2019.
- ^ "London Borough of Barking & Dagenham Election Results 1964-2010" (PDF). Elections Centre. Plymouth University. Retrieved 25 May 2019.
- ^ "London Borough Council Elections 4 May 2006" (PDF). London Datastore. London Residuary Body. Retrieved 25 May 2019.
- ^ "London Borough By Election results". Gwydir. Keith Edkins. Archived from the original on 12 June 2019. Retrieved 25 May 2019.
- ^ "Barking and Dagenham election results". Barking and Dagenham Council elections. Barking and Dagenham Council. Archived from the original on 3 May 2019. Retrieved 29 May 2019.