249:
229:
206:
183:
152:
109:
89:
278:
Applying these rules indicates when a potential "out of control" situation has arisen. However, there will always be some false alerts and the more rules applied the more will occur. For some processes, it may be beneficial to omit one or more rules. Equally there may be some missing alerts where
274:
An example moving range: if N = 3 and values are 1, 3, 5, 3, 3, 2, 4, 5 then the sets of adjacent points are (1,3,5) (3,5,3) (5,3,3) (3,3,2) (3,2,4) (2,4,5) resulting in moving range values of (5-1) (5-3) (5-3) (3-2) (4-2) (5-2) = 4, 2, 2, 1, 2, 3.
26:
of determining whether some measured variable is out of control (unpredictable versus consistent). Rules for detecting "out-of-control" or non-random conditions were first postulated by
335:
392:
167:
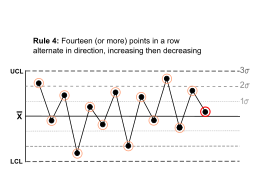
Note that the rule is concerned with directionality only. The position of the mean and the size of the standard deviation have no bearing.
347:
Lloyd S. Nelson, "The
Shewhart Control Chart—Tests for Special Causes". Journal of Quality Technology 16, no. 4 (October 1984), 238-239.
367:
244:
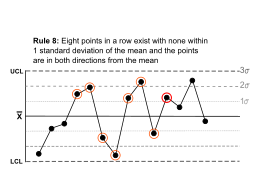
Eight points in a row exist, but none within 1 standard deviation of the mean, and the points are in both directions from the mean.
387:
267:
chart, can also be used but only with rules 1, 2, 3 and 4. Such a chart plots a graph of the maximum value - minimum value of
382:
292:
32:
312:
297:
178:
Two (or three) out of three points in a row are more than 2 standard deviations from the mean in the same direction.
201:
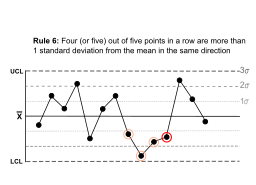
Four (or five) out of five points in a row are more than 1 standard deviation from the mean in the same direction.
158:
248:
228:
205:
182:
151:
108:
88:
302:
48:
37:
224:
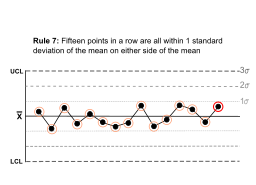
Fifteen points in a row are all within 1 standard deviation of the mean on either side of the mean.
331:
264:
56:
27:
254:
Jumping from above to below while missing the first standard deviation band is rarely random.
134:
115:
23:
307:
147:
Fourteen (or more) points in a row alternate in direction, increasing then decreasing.
30:
in the 1920s. The Nelson rules were first published in the
October 1984 issue of the
376:
279:
some specific "out of control" situation is not detected. Empirically, the detection
44:
162:
348:
362:
280:
128:
Six (or more) points in a row are continually increasing (or decreasing).
211:
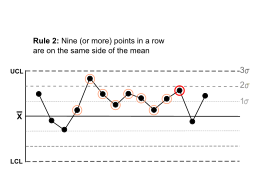
There is a strong tendency for samples to be slightly out of control.
188:
There is a medium tendency for samples to be mediumly out of control.
234:
With 1 standard deviation, greater variation would be expected.
104:
Nine (or more) points in a row are on the same side of the mean.
52:
94:
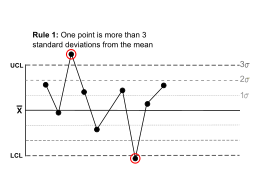
One sample (two shown in this case) is grossly out of control.
260:
The above eight rules apply to a chart of a variable value.
84:
One point is more than 3 standard deviations from the mean.
213:
The side of the mean for the fifth point is unspecified.
190:
The side of the mean for the third point is unspecified.
271:
adjacent points against the time sample of the range.
363:
Small
Business Guidebook to Quality Management (pdf)
51:
is plotted against time. The rules are based on the
334:, NIST/SEMATECH e-Handbook of Statistical Methods
16:Decision rules for interpreting control-chart data
349:https://doi.org/10.1080/00224065.1984.11978921
336:National Institute of Standards and Technology
8:
61:
324:
332:Engineering Statistics Handbook 6.3.2
7:
14:
247:
227:
204:
181:
150:
107:
87:
393:Statistical charts and diagrams
47:on which the magnitude of some
293:Common cause and special cause
1:
33:Journal of Quality Technology
313:American Society for Quality
298:Statistical process control
263:A second chart, the moving
93:
83:
43:The rules are applied to a
409:
78:
388:Technical communication
303:Western Electric rules
383:Quality control tools
74:Problem Indicated
57:standard deviation
28:Walter A. Shewhart
258:
257:
36:in an article by
400:
351:
345:
339:
329:
251:
231:
208:
185:
154:
111:
91:
62:
59:of the samples.
22:are a method in
408:
407:
403:
402:
401:
399:
398:
397:
373:
372:
359:
354:
346:
342:
330:
326:
322:
315:, Quality Tools
289:
241:
221:
198:
175:
144:
125:
114:Some prolonged
101:
81:
24:process control
17:
12:
11:
5:
406:
404:
396:
395:
390:
385:
375:
374:
371:
370:
365:
358:
357:External links
355:
353:
352:
340:
323:
321:
318:
317:
316:
310:
308:Westgard rules
305:
300:
295:
288:
285:
256:
255:
252:
245:
242:
239:
236:
235:
232:
225:
222:
219:
216:
215:
209:
202:
199:
196:
193:
192:
186:
179:
176:
173:
170:
169:
155:
148:
145:
142:
139:
138:
131:
129:
126:
123:
120:
119:
112:
105:
102:
99:
96:
95:
92:
85:
82:
79:
76:
75:
72:
69:
66:
55:value and the
38:Lloyd S Nelson
15:
13:
10:
9:
6:
4:
3:
2:
405:
394:
391:
389:
386:
384:
381:
380:
378:
369:
368:Control Chart
366:
364:
361:
360:
356:
350:
344:
341:
337:
333:
328:
325:
319:
314:
311:
309:
306:
304:
301:
299:
296:
294:
291:
290:
286:
284:
282:
276:
272:
270:
266:
261:
253:
250:
246:
243:
238:
237:
233:
230:
226:
223:
218:
217:
214:
210:
207:
203:
200:
195:
194:
191:
187:
184:
180:
177:
172:
171:
168:
164:
160:
156:
153:
149:
146:
141:
140:
136:
132:
130:
127:
122:
121:
117:
113:
110:
106:
103:
98:
97:
90:
86:
77:
73:
71:Chart Example
70:
67:
64:
63:
60:
58:
54:
50:
46:
45:control chart
41:
39:
35:
34:
29:
25:
21:
343:
327:
277:
273:
268:
262:
259:
212:
189:
166:
42:
31:
20:Nelson rules
19:
18:
159:oscillation
68:Description
377:Categories
338:, Dec 2006
320:References
161:is beyond
157:This much
283:is good.
287:See also
281:accuracy
137:exists.
118:exists.
49:variable
240:Rule 8
220:Rule 7
197:Rule 6
174:Rule 5
143:Rule 4
124:Rule 3
100:Rule 2
80:Rule 1
265:range
163:noise
135:trend
116:bias
65:Rule
53:mean
379::
165:.
133:A
40:.
269:N
Text is available under the Creative Commons Attribution-ShareAlike License. Additional terms may apply.