213:
198:
183:
168:
142:
An important aspect of the
Western Electric rules are the zone rules, designed to detect process instability, and the presence of assignable causes. Data sets of observations are appraised by four basic rules, that categorize the occurrence of data samples in a set of zones defined by multiples of
225:
Data satisfying any of these conditions as indicated by the control chart provide the justification for investigating the process to discover whether assignable causes are present and can be removed. Note that there is always a possibility of
230:: Assuming observations are normally distributed, one expects Rule 1 to be triggered by chance one out of every 370 observations on average. The false alarm rate rises to one out of every 91.75 observations when evaluating all four rules.
221:
These rules are evaluated for one side of the center line (one half of the control band) at a time (e.g., first the centerline to the upper control limit, then the centerline to the lower control limit).
277:(which plot the behavior of the subgroup range), the Handbook recommends using the zone rules above for subgroups of sufficient size (five or more). For small sample subgroups, the Handbook recommends:
51:
and appeared in the first edition of a 1956 handbook, that became a standard text of the field. Their purpose was to ensure that line workers and engineers interpret control charts in a uniform way.
242:
with symmetric control limits. The handbook provides additional guidelines for control charts where the control limits are not symmetrical, as for R charts and p-charts.
273:
163:
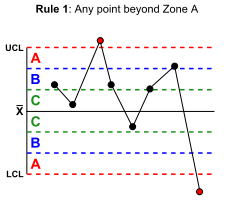
Any single data point falls outside the 3σ-limit from the centerline (i.e., any point that falls outside Zone A, beyond either the upper or lower control limit)
344:
The handbook also identifies patterns that require consideration of both the upper and lower halves of the control chart together for identification:
658:
471:
415:
A series of out-of-control points in the lower zones followed by a series of out-of-control points in the upper zones or vice versa
653:
648:
610:
Champ, Charles W.; Woodall, William H (1987), "Exact
Results for Shewhart Control Charts with Supplementary Runs Rules",
193:
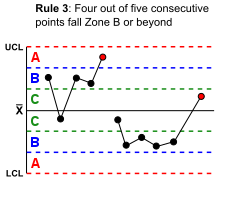
Four out of five consecutive points fall beyond the 1σ-limit (in zone B or beyond), on the same side of the centerline
178:
Two out of three consecutive points fall beyond the 2σ-limit (in zone A or beyond), on the same side of the centerline
28:
47:. The Western Electric rules were codified by a specially-appointed committee of the manufacturing division of the
581:
552:
523:
494:
48:
212:
197:
182:
167:
76:
Other unnatural patterns are categorized as systematic (autocorrelative), repetition, or trend patterns.
67:
based on several criteria: The absence of points near the centerline is identified as a mixture pattern.
589:
560:
531:
502:
463:
459:
625:
335:
Devising tests that should result in the desired sensitivity to the presence of assignable causes
80:
40:
249:
39:. Locations of the observations relative to the control chart control limits (typically at ±3
593:
564:
535:
506:
477:
467:
60:
617:
246:
44:
378:
Eight consecutive points on both sides of the centerline with no points falling in zone C.
73:
The presence of points outside the control limits is identified as an instability pattern.
387:
64:
70:
The absence of points near the control limits is identified as a stratification pattern.
434:
227:
208:
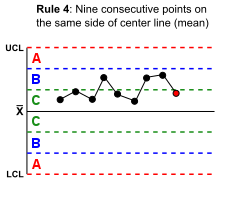
Eight consecutive points fall on the same side of the centerline (in zone C or beyond)
79:
This classification divides the chart of observations into zones, measured in units of
24:
642:
612:
303:
Seven consecutive points falling above the centerline (in the upper zone C or above)
239:
43:) and centerline indicate whether the process in question should be investigated for
36:
298:
Three consecutive points falling above the +1σ-limit (in the upper zone B or above)
429:
308:
Ten consecutive points falling below the centerline (in the lower zone C or below)
313:
Six consecutive points falling below the -1σ-limit (in the lower zone B or below)
293:
Two consecutive points falling above the +2σ-limit (in the upper zone A or above)
616:, vol. 29, no. 4, American Society for Quality, pp. 393–399,
597:
568:
539:
510:
481:
318:
Four consecutive points falling below the -2σ-limit (in the lower zone A)
629:
401:
The tendency of one chart to follow the same pattern as its predecessor
325:
32:
621:
390:—a long series of observations that alternate high-low-high-low
83:(σ) between the centerline and control limits, as follows:
100:
Between 2σ from the centerline and the control limit (3σ)
346:
279:
85:
252:
367:
Fifteen consecutive points fall within ±1σ (zone C)
332:
Finding the probabilities associated with each zone
288:Any single data point falling above the +3σ limit
267:
16:Decision rules for interpreting control-chart data
417:A series of points without a change in direction
412:Sustained drift or shift in the long-term mean
8:
456:Introduction to Statistical Quality Control
122:Zones A, B, and C are sometimes called the
364:Variation small relative to control limits
254:
253:
251:
592:: Western Electric Co., pp. 25–28,
328:distributions, the Handbook recommends:
238:The zone rules presented above apply to
145:
446:
108:Between 1σ and 2σ from the centerline
557:Statistical Quality Control Handbook.
528:Statistical Quality Control Handbook.
499:Statistical Quality Control Handbook.
7:
586:Statistical Quality Control Handbook
563:: Western Electric Co., p. 24,
534:: Western Electric Co., p. 25,
375:The tendency to avoid the centerline
31:for detecting out-of-control or non-
505:: Western Electric Co., p. v,
324:For other control charts based on
14:
59:The rules attempt to distinguish
211:
196:
181:
166:
659:Statistical charts and diagrams
454:Montgomery, Douglas C. (2005),
259:
1:
116:Within 1σ of the centerline
283:Small-sample R chart rules
29:statistical process control
675:
268:{\displaystyle {\bar {x}}}
234:Asymmetric control limits
582:Western Electric Company
553:Western Electric Company
524:Western Electric Company
495:Western Electric Company
340:Other unnatural patterns
143:the standard deviation.
49:Western Electric Company
654:Technical communication
269:
21:Western Electric rules
649:Quality control tools
590:Indianapolis, Indiana
561:Indianapolis, Indiana
532:Indianapolis, Indiana
503:Indianapolis, Indiana
464:John Wiley & Sons
270:
250:
460:Hoboken, New Jersey
41:standard deviations
265:
81:standard deviation
61:unnatural patterns
473:978-0-471-65631-9
421:
420:
322:
321:
262:
219:
218:
120:
119:
45:assignable causes
666:
633:
632:
607:
601:
600:
578:
572:
571:
549:
543:
542:
520:
514:
513:
491:
485:
484:
451:
404:(No rule given)
393:(No rule given)
347:
280:
274:
272:
271:
266:
264:
263:
255:
215:
200:
185:
170:
146:
134:, respectively.
124:three sigma zone
86:
65:natural patterns
674:
673:
669:
668:
667:
665:
664:
663:
639:
638:
637:
636:
622:10.2307/1269449
609:
608:
604:
580:
579:
575:
551:
550:
546:
522:
521:
517:
493:
492:
488:
474:
453:
452:
448:
443:
426:
416:
388:autocorrelation
342:
248:
247:
236:
228:false positives
140:
57:
17:
12:
11:
5:
672:
670:
662:
661:
656:
651:
641:
640:
635:
634:
602:
588:(1 ed.),
573:
559:(1 ed.),
544:
530:(1 ed.),
515:
501:(1 ed.),
486:
472:
458:(5 ed.),
445:
444:
442:
439:
438:
437:
435:Westgard rules
432:
425:
422:
419:
418:
413:
410:
406:
405:
402:
399:
395:
394:
391:
384:
380:
379:
376:
373:
369:
368:
365:
362:
361:Stratification
358:
357:
354:
351:
341:
338:
337:
336:
333:
320:
319:
315:
314:
310:
309:
305:
304:
300:
299:
295:
294:
290:
289:
285:
284:
261:
258:
240:control charts
235:
232:
217:
216:
209:
206:
202:
201:
194:
191:
187:
186:
179:
176:
172:
171:
164:
161:
157:
156:
155:Chart example
153:
150:
139:
136:
132:one sigma zone
128:two sigma zone
118:
117:
114:
110:
109:
106:
102:
101:
98:
94:
93:
90:
56:
53:
37:control charts
35:conditions on
25:decision rules
15:
13:
10:
9:
6:
4:
3:
2:
671:
660:
657:
655:
652:
650:
647:
646:
644:
631:
627:
623:
619:
615:
614:
613:Technometrics
606:
603:
599:
595:
591:
587:
583:
577:
574:
570:
566:
562:
558:
554:
548:
545:
541:
537:
533:
529:
525:
519:
516:
512:
508:
504:
500:
496:
490:
487:
483:
479:
475:
469:
465:
461:
457:
450:
447:
440:
436:
433:
431:
428:
427:
423:
414:
411:
408:
407:
403:
400:
397:
396:
392:
389:
385:
382:
381:
377:
374:
371:
370:
366:
363:
360:
359:
355:
352:
349:
348:
345:
339:
334:
331:
330:
329:
327:
317:
316:
312:
311:
307:
306:
302:
301:
297:
296:
292:
291:
287:
286:
282:
281:
278:
276:
256:
243:
241:
233:
231:
229:
223:
214:
210:
207:
204:
203:
199:
195:
192:
189:
188:
184:
180:
177:
174:
173:
169:
165:
162:
159:
158:
154:
151:
148:
147:
144:
137:
135:
133:
129:
125:
115:
112:
111:
107:
104:
103:
99:
96:
95:
91:
88:
87:
84:
82:
77:
74:
71:
68:
66:
62:
54:
52:
50:
46:
42:
38:
34:
30:
26:
22:
611:
605:
585:
576:
556:
547:
527:
518:
498:
489:
455:
449:
430:Nelson rules
343:
323:
275:and R charts
244:
237:
224:
220:
152:Description
141:
131:
127:
123:
121:
78:
75:
72:
69:
58:
20:
18:
353:Description
643:Categories
441:References
398:Repetition
383:Systematic
138:Zone rules
55:Motivation
386:Negative
260:¯
598:33858387
584:(1956),
569:33858387
555:(1956),
540:33858387
526:(1956),
511:33858387
497:(1956),
482:56729567
424:See also
630:1269449
372:Mixture
350:Pattern
205:Rule 4
190:Rule 3
175:Rule 2
160:Rule 1
149:
92:Region
628:
596:
567:
538:
509:
480:
470:
326:skewed
130:, and
113:Zone C
105:Zone B
97:Zone A
33:random
626:JSTOR
409:Trend
356:Rule
63:from
594:OCLC
565:OCLC
536:OCLC
507:OCLC
478:OCLC
468:ISBN
245:For
89:Zone
23:are
19:The
618:doi
27:in
645::
624:,
476:,
466:,
462::
126:,
620::
257:x
Text is available under the Creative Commons Attribution-ShareAlike License. Additional terms may apply.