720:
exceeds a certain threshold value, a change in value has been found. The above formula only detects changes in the positive direction. When negative changes need to be found as well, the min operation should be used instead of the max operation, and this time a change has been found when the value of
330:
218:
1378:
1238:
1098:
486:. He devised CUSUM as a method to determine changes in it, and proposed a criterion for deciding when to take corrective action. When the CUSUM method is applied to changes in mean, it can be used for
711:
412:
759:
This differs from SPRT by always using zero function as the lower "holding barrier" rather than a lower "holding barrier". Also, CUSUM does not require the use of the likelihood function.
782:, 1936). On the other hand, for constant poor quality the A.R.L. measures the delay and thus the amount of scrap produced before the rectifying action is taken, i.e.,
997:
581:
970:
879:
1423:
1403:
750:
617:
519:
476:
1268:
1128:
906:
554:
1021:
939:
856:
836:
813:
774:
When the quality of the output is satisfactory the A.R.L. is a measure of the expense incurred by the scheme when it gives false alarms, i.e.,
1437:
229:
117:
1430:
1668:
1560:
1472:
Grigg; Farewell, VT; Spiegelhalter, DJ; et al. (2003). "The Use of Risk-Adjusted CUSUM and RSPRT Charts for
Monitoring in Medical Contexts".
1279:
1139:
529:
As its name implies, CUSUM involves the calculation of a cumulative sum (which is what makes it "sequential"). Samples from a process
1619:
452:
59:
1032:
1405:
is a critical level parameter (tunable, same as threshold T) that's used to adjust the sensitivity of change detection: larger
623:
1447:
1673:
1629:
341:
1678:
420:
1585:
779:
479:
436:
1555:
498:
753:
432:
69:
1653:
881:), so simply alerting on a high deviation will not detect a failure, whereas CUSUM shows that the
1565:
1537:
975:
559:
1641:
1436:
946:
1637:
1630:"A Multivariate Cumulative Sum Method for Continuous Damage Monitoring with Lamb-wave Sensors"
1615:
1489:
861:
501:
developed a visualization method, the V-mask chart, to detect both increases and decreases in
1429:
1408:
1388:
735:
589:
504:
461:
1527:
1519:
1481:
440:
1246:
1106:
884:
532:
767:
1006:
924:
841:
821:
798:
487:
770:; "the expected number of articles sampled before action is taken." He further wrote:
1662:
1583:"Sufficient statistics and uniformly most powerful tests of statistical hypotheses".
783:
775:
448:
325:{\displaystyle C_{i}^{-}=\max \lbrack 0,\left(T-K\right)-x_{i}+C_{i-1}^{-}\rbrack }
213:{\displaystyle C_{i}^{+}=\max \lbrack 0,x_{i}-\left(T+K\right)+C_{i-1}^{+}\rbrack }
1523:
491:
1485:
1532:
444:
1493:
1569:
1541:
1609:
1373:{\displaystyle {S_{L}}_{n+1}=\max(0,{S_{L}}_{n}-Z_{n+1}-\omega )}
1233:{\displaystyle {S_{H}}_{n+1}=\max(0,{S_{H}}_{n}+Z_{n+1}-\omega )}
483:
815:
of a process with a mean of 0 and a standard deviation of 0.5.
1029:
centered around the mean and scaled by the standard deviation
762:
As a means of assessing CUSUM's performance, Page defined the
1093:{\displaystyle Z_{n}={\frac {X_{n}-{\bar {x}}}{\sigma _{X}}}}
1634:
International
Journal of Prognostics and Health Management
1654:"Engineering Statistics Handbook - Cusum Control Charts"
1510:
Page, E. S. (June 1954). "Continuous
Inspection Scheme".
1425:
makes CUSUM less sensitive to the change and vice versa.
706:{\displaystyle S_{n+1}=\max(0,S_{n}+x_{n+1}-\omega _{n})}
1608:
Michèle
Basseville and Igor V. Nikiforov (April 1993).
943:
The observations of the process with an expected mean
1411:
1391:
1282:
1249:
1142:
1109:
1035:
1009:
978:
949:
927:
887:
864:
844:
824:
801:
738:
626:
592:
562:
535:
507:
464:
407:{\displaystyle C_{i}=\sum _{j=1}^{i}{\bar {x}}_{j}-T}
344:
232:
120:
1611:
Detection of Abrupt
Changes: Theory and Application
1558:(1959). "Control charts and stochastic processes".
335:
223:
111:
103:
98:
88:
80:
75:
65:
55:
47:
39:
34:
26:
21:
1417:
1397:
1372:
1262:
1232:
1122:
1092:
1015:
991:
964:
933:
900:
873:
850:
830:
807:
744:
705:
611:
575:
548:
513:
470:
406:
324:
212:
107:The target value, T, of the quality characteristic
1628:Mishra, S., Vanli, O. A., & Park, C (2015).
1311:
1171:
646:
447:, in 1954, a few years after the publication of
251:
139:
1564:. B (Methodological) (21, number 2): 239–71.
729:the (negative) value of the threshold value.
8:
795:The following example shows 20 observations
319:
254:
207:
142:
1276:CUSUM value, detecting a negative anomaly,
1136:CUSUM value, detecting a positive anomaly,
458:E. S. Page referred to a "quality number"
51:Cumulative sum of a quality characteristic
1531:
1410:
1390:
1349:
1336:
1329:
1324:
1296:
1289:
1284:
1281:
1254:
1248:
1209:
1196:
1189:
1184:
1156:
1149:
1144:
1141:
1114:
1108:
1082:
1066:
1065:
1056:
1049:
1040:
1034:
1008:
983:
977:
951:
950:
948:
926:
908:value exceeds 4 at the 17th observation.
892:
886:
863:
858:never deviates by 3 standard deviations (
843:
823:
800:
737:
694:
675:
662:
631:
625:
597:
591:
567:
561:
540:
534:
506:
463:
435:technique developed by E. S. Page of the
392:
381:
380:
373:
362:
349:
343:
313:
302:
289:
242:
237:
231:
201:
190:
155:
130:
125:
119:
1561:Journal of the Royal Statistical Society
1448:Cumulative observed-minus-expected plots
972:of 0 and an expected standard deviation
1614:. Englewood Cliffs, NJ: Prentice-Hall.
1474:Statistical Methods in Medical Research
1467:
1465:
1463:
1459:
478:, by which he meant a parameter of the
1505:
1503:
439:. It is typically used for monitoring
18:
7:
14:
732:Page did not explicitly say that
453:sequential probability ratio test
1435:
1428:
1669:Statistical charts and diagrams
1367:
1314:
1227:
1174:
1071:
956:
700:
649:
386:
1:
1025:The normalized observations,
16:Sequential analysis technique
1586:Statistical Research Memoirs
838:column, it can be seen that
756:, but this is common usage.
429:cumulative sum control chart
992:{\displaystyle \sigma _{X}}
576:{\displaystyle \omega _{n}}
421:statistical quality control
56:Quality characteristic type
1695:
1486:10.1177/096228020301200205
965:{\displaystyle {\bar {x}}}
1524:10.1093/biomet/41.1-2.100
583:, and summed as follows:
443:. CUSUM was announced in
93:
874:{\displaystyle 3\sigma }
480:probability distribution
1418:{\displaystyle \omega }
1398:{\displaystyle \omega }
745:{\displaystyle \omega }
612:{\displaystyle S_{0}=0}
514:{\displaystyle \theta }
471:{\displaystyle \theta }
437:University of Cambridge
89:Process variation chart
81:Size of shift to detect
66:Underlying distribution
1450:are a related method.
1419:
1399:
1374:
1264:
1234:
1124:
1094:
1017:
993:
966:
935:
902:
875:
852:
832:
809:
788:
746:
707:
613:
577:
550:
515:
472:
408:
378:
326:
214:
40:Rational subgroup size
27:Originally proposed by
1674:Quality control tools
1420:
1400:
1375:
1265:
1263:{\displaystyle S_{L}}
1235:
1125:
1123:{\displaystyle S_{H}}
1095:
1018:
994:
967:
936:
903:
901:{\displaystyle S_{H}}
876:
853:
833:
810:
772:
747:
708:
614:
578:
556:are assigned weights
551:
549:{\displaystyle x_{n}}
516:
499:George Alfred Barnard
473:
409:
358:
327:
215:
1409:
1389:
1280:
1247:
1140:
1107:
1033:
1007:
976:
947:
925:
885:
862:
842:
822:
799:
780:Neyman & Pearson
736:
624:
590:
560:
533:
505:
462:
342:
230:
118:
35:Process observations
754:likelihood function
497:A few years later,
482:; for example, the
433:sequential analysis
318:
247:
224:Lower control limit
206:
135:
112:Upper control limit
70:Normal distribution
1679:Sequential methods
1533:10338.dmlcz/135207
1415:
1395:
1370:
1260:
1230:
1120:
1090:
1013:
989:
962:
931:
898:
871:
848:
828:
805:
764:average run length
742:
716:When the value of
703:
609:
573:
546:
511:
468:
404:
322:
298:
233:
210:
186:
121:
99:Process mean chart
1383:
1382:
1088:
1074:
1016:{\displaystyle Z}
959:
934:{\displaystyle X}
851:{\displaystyle X}
831:{\displaystyle Z}
808:{\displaystyle X}
417:
416:
389:
336:Plotted statistic
1686:
1625:
1595:
1594:
1580:
1574:
1573:
1552:
1546:
1545:
1535:
1518:(1/2): 100–115.
1507:
1498:
1497:
1469:
1439:
1432:
1424:
1422:
1421:
1416:
1404:
1402:
1401:
1396:
1379:
1377:
1376:
1371:
1360:
1359:
1341:
1340:
1335:
1334:
1333:
1307:
1306:
1295:
1294:
1293:
1269:
1267:
1266:
1261:
1259:
1258:
1239:
1237:
1236:
1231:
1220:
1219:
1201:
1200:
1195:
1194:
1193:
1167:
1166:
1155:
1154:
1153:
1129:
1127:
1126:
1121:
1119:
1118:
1099:
1097:
1096:
1091:
1089:
1087:
1086:
1077:
1076:
1075:
1067:
1061:
1060:
1050:
1045:
1044:
1022:
1020:
1019:
1014:
998:
996:
995:
990:
988:
987:
971:
969:
968:
963:
961:
960:
952:
940:
938:
937:
932:
911:
910:
907:
905:
904:
899:
897:
896:
880:
878:
877:
872:
857:
855:
854:
849:
837:
835:
834:
829:
814:
812:
811:
806:
751:
749:
748:
743:
712:
710:
709:
704:
699:
698:
686:
685:
667:
666:
642:
641:
618:
616:
615:
610:
602:
601:
582:
580:
579:
574:
572:
571:
555:
553:
552:
547:
545:
544:
520:
518:
517:
512:
477:
475:
474:
469:
441:change detection
413:
411:
410:
405:
397:
396:
391:
390:
382:
377:
372:
354:
353:
331:
329:
328:
323:
317:
312:
294:
293:
281:
277:
246:
241:
219:
217:
216:
211:
205:
200:
182:
178:
160:
159:
134:
129:
48:Measurement type
19:
1694:
1693:
1689:
1688:
1687:
1685:
1684:
1683:
1659:
1658:
1650:
1622:
1607:
1604:
1602:Further reading
1599:
1598:
1582:
1581:
1577:
1554:
1553:
1549:
1509:
1508:
1501:
1471:
1470:
1461:
1456:
1445:
1407:
1406:
1387:
1386:
1345:
1325:
1323:
1285:
1283:
1278:
1277:
1250:
1245:
1244:
1205:
1185:
1183:
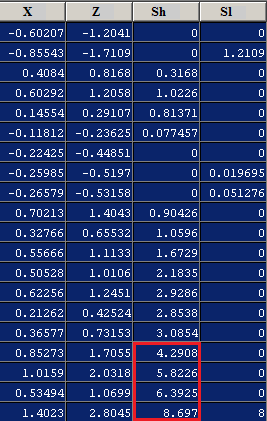
1145:
1143:
1138:
1137:
1110:
1105:
1104:
1078:
1052:
1051:
1036:
1031:
1030:
1005:
1004:
979:
974:
973:
945:
944:
923:
922:
888:
883:
882:
860:
859:
840:
839:
820:
819:
797:
796:
793:
752:represents the
734:
733:
690:
671:
658:
627:
622:
621:
593:
588:
587:
563:
558:
557:
536:
531:
530:
527:
503:
502:
460:
459:
379:
345:
340:
339:
285:
267:
263:
228:
227:
168:
164:
151:
116:
115:
17:
12:
11:
5:
1692:
1690:
1682:
1681:
1676:
1671:
1661:
1660:
1657:
1656:
1649:
1648:External links
1646:
1645:
1644:
1626:
1620:
1603:
1600:
1597:
1596:
1575:
1547:
1499:
1480:(2): 147–170.
1458:
1457:
1455:
1452:
1444:
1441:
1414:
1394:
1381:
1380:
1369:
1366:
1363:
1358:
1355:
1352:
1348:
1344:
1339:
1332:
1328:
1322:
1319:
1316:
1313:
1310:
1305:
1302:
1299:
1292:
1288:
1270:
1257:
1253:
1241:
1240:
1229:
1226:
1223:
1218:
1215:
1212:
1208:
1204:
1199:
1192:
1188:
1182:
1179:
1176:
1173:
1170:
1165:
1162:
1159:
1152:
1148:
1130:
1117:
1113:
1101:
1100:
1085:
1081:
1073:
1070:
1064:
1059:
1055:
1048:
1043:
1039:
1023:
1012:
1001:
1000:
986:
982:
958:
955:
941:
930:
919:
918:
915:
895:
891:
870:
867:
847:
827:
804:
792:
789:
784:Type II errors
741:
714:
713:
702:
697:
693:
689:
684:
681:
678:
674:
670:
665:
661:
657:
654:
651:
648:
645:
640:
637:
634:
630:
619:
608:
605:
600:
596:
570:
566:
543:
539:
526:
523:
510:
488:step detection
467:
415:
414:
403:
400:
395:
388:
385:
376:
371:
368:
365:
361:
357:
352:
348:
337:
333:
332:
321:
316:
311:
308:
305:
301:
297:
292:
288:
284:
280:
276:
273:
270:
266:
262:
259:
256:
253:
250:
245:
240:
236:
225:
221:
220:
209:
204:
199:
196:
193:
189:
185:
181:
177:
174:
171:
167:
163:
158:
154:
150:
147:
144:
141:
138:
133:
128:
124:
113:
109:
108:
105:
101:
100:
96:
95:
94:Not applicable
91:
90:
86:
85:
82:
78:
77:
73:
72:
67:
63:
62:
60:Variables data
57:
53:
52:
49:
45:
44:
41:
37:
36:
32:
31:
28:
24:
23:
15:
13:
10:
9:
6:
4:
3:
2:
1691:
1680:
1677:
1675:
1672:
1670:
1667:
1666:
1664:
1655:
1652:
1651:
1647:
1643:
1639:
1635:
1631:
1627:
1623:
1621:0-13-126780-9
1617:
1613:
1612:
1606:
1605:
1601:
1592:
1588:
1587:
1579:
1576:
1571:
1567:
1563:
1562:
1557:
1556:Barnard, G.A.
1551:
1548:
1543:
1539:
1534:
1529:
1525:
1521:
1517:
1513:
1506:
1504:
1500:
1495:
1491:
1487:
1483:
1479:
1475:
1468:
1466:
1464:
1460:
1453:
1451:
1449:
1442:
1440:
1438:
1433:
1431:
1426:
1412:
1392:
1364:
1361:
1356:
1353:
1350:
1346:
1342:
1337:
1330:
1326:
1320:
1317:
1308:
1303:
1300:
1297:
1290:
1286:
1275:
1271:
1255:
1251:
1243:
1242:
1224:
1221:
1216:
1213:
1210:
1206:
1202:
1197:
1190:
1186:
1180:
1177:
1168:
1163:
1160:
1157:
1150:
1146:
1135:
1131:
1115:
1111:
1103:
1102:
1083:
1079:
1068:
1062:
1057:
1053:
1046:
1041:
1037:
1028:
1024:
1010:
1003:
1002:
984:
980:
953:
942:
928:
921:
920:
916:
913:
912:
909:
893:
889:
868:
865:
845:
825:
816:
802:
790:
787:
785:
781:
777:
776:Type I errors
771:
769:
765:
760:
757:
755:
739:
730:
728:
724:
719:
695:
691:
687:
682:
679:
676:
672:
668:
663:
659:
655:
652:
643:
638:
635:
632:
628:
620:
606:
603:
598:
594:
586:
585:
584:
568:
564:
541:
537:
524:
522:
508:
500:
495:
493:
489:
485:
481:
465:
456:
454:
450:
446:
442:
438:
434:
430:
426:
422:
401:
398:
393:
383:
374:
369:
366:
363:
359:
355:
350:
346:
338:
334:
314:
309:
306:
303:
299:
295:
290:
286:
282:
278:
274:
271:
268:
264:
260:
257:
248:
243:
238:
234:
226:
222:
202:
197:
194:
191:
187:
183:
179:
175:
172:
169:
165:
161:
156:
152:
148:
145:
136:
131:
126:
122:
114:
110:
106:
102:
97:
92:
87:
83:
79:
74:
71:
68:
64:
61:
58:
54:
50:
46:
42:
38:
33:
29:
25:
20:
1633:
1610:
1590:
1584:
1578:
1559:
1550:
1515:
1511:
1477:
1473:
1446:
1434:
1427:
1384:
1273:
1133:
1026:
917:Description
817:
794:
773:
763:
761:
758:
731:
726:
722:
717:
715:
528:
496:
457:
428:
424:
418:
492:time series
104:Center line
76:Performance
22:CUSUM chart
1663:Categories
1593:: 113–137.
1512:Biometrika
1454:References
445:Biometrika
30:E. S. Page
1642:2153-2648
1413:ω
1393:ω
1365:ω
1362:−
1343:−
1225:ω
1222:−
1080:σ
1072:¯
1063:−
981:σ
957:¯
869:σ
818:From the
766:(A.R.L.)
740:ω
692:ω
688:−
565:ω
509:θ
466:θ
399:−
387:¯
360:∑
315:−
307:−
283:−
272:−
244:−
195:−
162:−
1494:12665208
1443:Variants
455:(SPRT).
1570:2983801
1542:2333009
999:of 0.5
791:Example
431:) is a
1640:
1618:
1568:
1540:
1492:
1385:where
914:Column
768:metric
525:Method
423:, the
84:≤ 1.5σ
1566:JSTOR
1538:JSTOR
727:below
490:of a
425:CUSUM
43:n = 1
1638:ISSN
1616:ISBN
1490:PMID
1272:The
1134:high
1132:The
1027:i.e.
484:mean
449:Wald
427:(or
1528:hdl
1520:doi
1482:doi
1312:max
1274:low
1172:max
725:is
647:max
451:'s
419:In
252:max
140:max
1665::
1636:,
1632:,
1589:.
1536:.
1526:.
1516:41
1514:.
1502:^
1488:.
1478:12
1476:.
1462:^
786:.
521:.
494:.
1624:.
1591:I
1572:.
1544:.
1530::
1522::
1496:.
1484::
1368:)
1357:1
1354:+
1351:n
1347:Z
1338:n
1331:L
1327:S
1321:,
1318:0
1315:(
1309:=
1304:1
1301:+
1298:n
1291:L
1287:S
1256:L
1252:S
1228:)
1217:1
1214:+
1211:n
1207:Z
1203:+
1198:n
1191:H
1187:S
1181:,
1178:0
1175:(
1169:=
1164:1
1161:+
1158:n
1151:H
1147:S
1116:H
1112:S
1084:X
1069:x
1058:n
1054:X
1047:=
1042:n
1038:Z
1011:Z
985:X
954:x
929:X
894:H
890:S
866:3
846:X
826:Z
803:X
778:(
723:S
718:S
701:)
696:n
683:1
680:+
677:n
673:x
669:+
664:n
660:S
656:,
653:0
650:(
644:=
639:1
636:+
633:n
629:S
607:0
604:=
599:0
595:S
569:n
542:n
538:x
402:T
394:j
384:x
375:i
370:1
367:=
364:j
356:=
351:i
347:C
320:]
310:1
304:i
300:C
296:+
291:i
287:x
279:)
275:K
269:T
265:(
261:,
258:0
255:[
249:=
239:i
235:C
208:]
203:+
198:1
192:i
188:C
184:+
180:)
176:K
173:+
170:T
166:(
157:i
153:x
149:,
146:0
143:[
137:=
132:+
127:i
123:C
Text is available under the Creative Commons Attribution-ShareAlike License. Additional terms may apply.