441:
is an example. The figure illustrates a single value (population) bounded in an arbitrary grid (square kilometers) with each cell in the grid represented by a color intensity proportionate to the value of the cell relative to all other cells. Some heat maps that are created using approximated regional data may show familiar geographic borders in the visualization where none really exist. The illusion of geographic borders is due to the existence of patterns within the dataset rather than the visualization technique. The figure on the right displaying a heat map of world population also contains this occurrence. Areas in rural parts of the United States and South
America may closely resemble familiar geographic borders in those regions.
252:: Working with small and large data sets, data scientists and data analysts look at and determine essential relationships and characteristics amongst different points in a data set as well as features of those data points. Data scientists and analysts work with a team of others in different professions. The use of heat maps make for a visually easy way to summarize findings and main components. There are other ways to represent data, however heat maps can visualize these data points and their relationships in a high dimensional space without becoming too compact and visually unappealing. Heat maps in data analysis, allow for specific variables of rows and/or columns on the axes and even on the diagonal.
351:
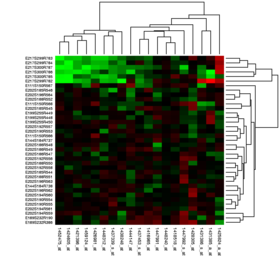
261:, focus on different concepts, some of which being community detection, association and correlation, and the concept of centrality, where heat maps are a compelling way to visually summarize results and to share amongst other professions not in the field of biology or bioinformatics. The two heat maps to the right, labeled "Data Analysis Heat Map Example," show different ways in which one may present genomic data over a specific region (Hist1 region) to someone outside the field of biology so they have a better understanding of the general concept a biologist or data scientist are trying to present.
418:
532:
327:
516:
572:
556:
54:
588:
604:
233:
268:: The values of different product and assets fluctuate both rapidly and/or gradually over time. The need to log changes to the daily markets is imperative. It allows for the ability to draw predictions from patterns while being able to revisit past numerical data. Heat maps are able to remove the tedious process and enable the user to visualize data points and compare amongst the different performers.
445:
241:
142:
205:: Heat maps are used in business analytics to give a visual representation about a company's current functioning, performance, and the need for improvements. Heat maps are a way to analyze a company's existing data and update it to reflect growth and other specific efforts. Heat maps visually appeal to team members and clients of the business or company.
463:
38:
303:
more shades of color than they can of gray, and this would purportedly increase the amount of detail perceivable in the image. However, this is heavily discouraged in the scientific community for a number of reasons. Possibly the largest reason is that when there is a large number of colors involved,
282:
Sports: Heat maps can be used in many sports and can influence manager's and/or coaches decisions based on high and low densities of data displayed. Users can identify patterns within the game, the strategies of opponents and one's own team, make more informed decisions benefitting the player, team,
177:
Correlogram: A correlogram is a clustered heat map that has the same trait for each axis in order to display how the traits in the set of traits interact with each other. The correlogram is a triangle instead of a square because the combination of A-B is the same as the combination of B-A and so does
208:
Websites: There are many different ways heat maps are used within websites to determine a visiting users actions. Typically, there are multiple heat maps used together to determine insight to a website on what are the best and worst performing elements on the page. Some specific heat maps used for
440:
Similarly, heat maps may also visualize data over a geographic region. However, unlike choropleth maps, heat maps show the proportion of a variable over an arbitrary, but usually small grid size, independent of geographic boundaries. The figure on the right displaying a heat map of world population
436:
Choropleth maps show data grouped by geographic boundaries like countries, states, provinces or even floodplains. Each region has a singular value, visualized by color intensity, shading or pattern. The figure on the right displaying a choropleth map showing the United States' population density by
432:
and heat maps are often used in place of one another incorrectly when referring to data visualized geographically. Both techniques show the proportion of a variable of interest, but the two differ in how the boundaries for the variable's data aggregations are constructed. If the data were collected
295:
can be used to illustrate the heat map, with perceptual advantages and disadvantages for each. Choosing a good color scheme is integral to accurately and effectively displaying data, whereas a poor color scheme can lead viewers to inaccurate conclusions or exclude those with color deficiencies from
169:
displays magnitude as color in a two-dimensional matrix, with each dimension representing a category of trait and the color representing the magnitude of some measurement on the combined traits from each of the two categories. For example, one dimension might represent year, and the other dimension
334:
In addition to audience considerations, it is also important to consider the form in which the data will be viewed. For example, if the data is to be printed in black and white or projected onto a large screen, it may be wise to adjust one's choice in color scheme. Common colormaps (like the "jet"
219:
Click
Tracking: Click tracking heat maps or touch maps, are similar to mouse tracking heat maps, but instead of hover actions, these types of heat maps help visualize the users click actions. Click tracking heat maps not only allow for visual cues on clickable components on a webpage, such as
274:
Visualization: Heat maps are used to visualize and display a geographic distribution of data. Heat maps represent different densities of data points on a geographical map to help users see the intensities of certain phenomena and to show items of most or least importance. Heat maps used in
223:
AI-Generation
Attention: AI-generated attention heat maps help visualize where the visiting user's attention will go on a certain section of a webpage. These types of heat maps are implemented using a created software algorithm to determine and predict the attention actions of the
170:
might represent month, and the value measured might be temperature. This heat map would show how temperature changed over the years in each month. Grid heat maps are further categorized into two different types of matrices: clustered, and correlogram.
304:
the visualization may give off the impression that there exist gradients in the data that are not really present. The more colors used in a visualization the more values begin to bleed together and color lacks the natural perceptual ordering found in
531:
256:
Biology: In the biological field, heat maps are used to visually represent large and small sets of data. The focus is towards patterns and similarities in DNA, RNA, gene expression, etc. Working with these sets of data, data scientists in
161:
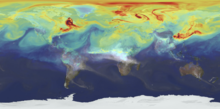
displays the magnitude of a spatial phenomena as color, usually cast over a map. In the image labeled "Spatial Heat Map
Example," temperature is displayed by color range across a map of the world. Color ranges from blue (cold) to red (hot).
283:
and business, and can enhance performance in different areas by identifying enhancement is needed. Heat maps also visualize comparisons and relationships amongst different teams in the same sport or between different sports all together.
571:
244:
Data
Analysis Heat Map Example: Subgraph of one of five hub nodes with a large degree of centrality in a genomic region in mice (Mus musculus) called the Hist1 region, where each cell in the graph represents one edge in the genomic
198:
Heat maps have a wide range of possibilities amongst applications due to their ability to simplify data and make for visually appealing to read data analysis. Many applications using different types of heat maps are listed below.
119:. The idea for joining cluster trees to the rows and columns of the data matrix originated with Robert Ling in 1973. Ling used overstruck printer characters to represent different shades of gray, one character-width per pixel.
437:
state may be used as an example. The figure illustrates a singular value (population) denoted by blue color intensity proportionate to the state's value relative to all other states' values, bounded by each state's border.
227:
Scroll
Tracking: Scroll tracking heat maps are used to represent the scrolling behavior of the website's users. This helps produce visual cues to what section on the website the user spends the most time
182:
In a grid heat map, colors are presented in a grid of a fixed size, with every cell in the grid also being an equal size and shape. The goal is to detect clustering, or suggest the presence of clusters.
315:
An important consideration when choosing a color scheme is whether or not the data will be viewed by anyone with any form of color deficiency. If the audience contains individuals with any form of
433:
and aggregated using irregular boundaries, such as administrative units, then a heat map displaying that data will be the same as a choropleth map, encouraging confusion about how the two differ.
555:
216:
Eye tracking: Eye tracking heat maps measure the eye position of the website's users and gathers measurements such as eye fixation volume, eye fixation duration, and areas of interest.
99:
Heat maps originated in 2D displays of the values in a data matrix. Larger values were represented by small dark gray or black squares (pixels) and smaller values by lighter squares.
515:
603:
339:. This also distracts from the actual data, arbitrarily making yellow and cyan regions appear more prominent than the regions of the data that are actually most important.
335:
colormap used as the default in many visualization software packages) have uncontrolled changes in luminance that prevent meaningful conversion to grayscale for display or
832:
Borkin MA, Gajos KZ, Peters A, Mitsouras D, Melchionna S, Rybicki FJ, et al. (December 2011). "Evaluation of artery visualizations for heart disease diagnosis".
127:) to produce cluster heat maps with high-resolution color graphics. The Eisen et al. display shown in the figure is a replication of the earlier SYSTAT design.
145:
Spatial Heat Map
Example: Displays temperature across a world image with red being the highest and blue being the lowest degree in temperatures (5 April 2019).
1548:
384:'cubehelix' colour scheme provides resources for a colour scheme that prints as a monotonically increasing greyscale on black and white postscript devices.
587:
236:
Data
Analysis Heat Map Example: Displays the normalized linkage disequilibrium of Genomic Windows within the Hist1 region of a mouse (Mus musculus).
408:
for data visualization that provide the ability to create interactive heat map charts, from basic to highly customized, as part of their solutions.
330:
A heat map showing the average temperature in the
Southern Rockies from 1950 to 2020 using the "Blues" color palette from the Color Brewer library
350:
1460:
722:
312:
colormaps. Additionally, values represented by different shades of the same color can imply that the values are related when they are not.
1589:
485:
625:
620:
499:
697:
354:
This heat map shows the normalized linkage disequilibrium of
Genomic Windows within the Hist1 region of a mouse (Mus musculus)
213:
Mouse Tracking: Mouse tracking heat maps or hover maps, are used to visualize where the user of the site hovers their cursor.
417:
73:
technique that represents the magnitude of individual values within a dataset as a color. The variation in color may be by
581:
and heat map, where the surface height represents the amplitude of the function, and the color represents the phase angle.
187:
477:
542:
111:
by permuting the rows and the columns of a matrix to place similar values near each other according to the clustering.
1579:
381:
220:
buttons or dropdown menus, but these heat maps also allow for tracking on non-clickable objects anywhere on the page.
362:, a free software environment for statistical computing and graphics, contains several functions to trace heat maps,
578:
326:
138:
information. The company that acquired Kinney's invention in 2003 unintentionally allowed the trademark to lapse.
249:
1026:
947:
359:
1574:
1569:
841:
661:
91:"Heat map" is a relatively new term, but the practice of shading matrices has existed for over a century.
1125:
1594:
965:
53:
84:
In some applications such as crime analytics or website click-tracking, color is used to represent the
1472:"Superheat: An R package for creating beautiful and extendable heatmaps for visualizing complex data"
1309:
903:
609:
Log10 of Mississippi River streamflow in cubic meters per second measured daily at Vicksburg MS USA.
371:
309:
666:
846:
124:
390:
3 can render a heat map layer of a selected property of all geographic features in a vector layer.
1584:
1483:
1401:
1366:
1150:
867:
679:
481:
405:
265:
70:
1511:
1456:
1436:
1337:
1284:
929:
859:
814:
718:
232:
202:
1532:
1501:
1493:
1448:
1426:
1391:
1358:
1327:
1317:
1075:
919:
911:
851:
806:
671:
135:
120:
108:
1536:
279:, but the difference comes with how certain data is presented which differentiate the two.
174:
Clustered heat map: The example of the monthly temperature by year is a clustered heat map.
1244:
1200:
316:
46:
997:
1313:
1100:
983:
907:
448:
A heat map visualizing population density per square kilometer around the world in 1994.
1506:
1471:
1272:
924:
891:
546:
429:
422:
320:
276:
258:
112:
100:
42:
739:"A Guide to Heatmaps: What is a Heatmap, the Use, and Types? | Attention Insight"
1563:
1549:"Strava, Popular With Cyclists and Runners, Wants to Sell Its Data to Urban Planners"
1332:
1297:
1175:
683:
562:
522:
375:
131:
116:
31:
368:, a universal and free command-line plotting program, can trace 2D and 3D heat maps.
103:(1873) used a shading matrix to visualize social statistics across the districts of
1405:
1362:
871:
300:
292:
271:
1497:
444:
190:), where there is no concept of cells, and instead the colours vary continuously.
1224:
712:
319:, it may be wise to avoid color schemes with prominent reds and greens or uneven
766:
630:
538:
240:
1302:
Proceedings of the National Academy of Sciences of the United States of America
915:
1431:
1414:
401:
387:
78:
1349:
Friendly M (March 1994). "Mosaic Displays for Multi-Way Contingency Tables".
1322:
797:
Borland D, Taylor MR (2007). "Rainbow color map (still) considered harmful".
738:
1012:
810:
781:"5 Real Heat Map Examples from Leading Industries [2022] | VWO"
753:"5 Real Heat Map Examples from Leading Industries [2022] | VWO"
594:
305:
141:
1515:
1440:
1288:
1050:
933:
863:
818:
652:
Wilkinson L, Friendly M (May 2009). "The History of the Cluster Heat Map".
134:
trademarked the term 'heat map' in 1991 to describe a 2D display depicting
1396:
1379:
1341:
855:
711:
Silhavy R, Senkerik R, Oplatkova ZK, Silhavy P, Prokopova Z (2016-04-26).
675:
780:
752:
397:
336:
17:
714:
Software Engineering Perspectives and Application in Intelligent Systems
561:
Example showing the relationships between a heat map, surface plot, and
1370:
365:
1488:
698:"United States Patent and Trademark Office, registration #75263259"
186:
A spatial heat map is often used on maps or satellite imagery (see
37:
443:
416:
393:
349:
325:
239:
231:
140:
115:
used a similar representation to display data that conformed to a
104:
52:
36:
1298:"Cluster analysis and display of genome-wide expression patterns"
347:
Several heat map software implementations are freely available:
88:
of data points rather than a value associated with each point.
767:"Guide to Geographic Heat Maps [Types & Examples]"
456:
74:
57:
A heat map showing the RF coverage of a drone detection system
1296:
Eisen MB, Spellman PT, Brown PO, Botstein D (December 1998).
1277:
Sémiologie Graphique. Les diagrammes, les réseaux, les cartes
472:
contains an unencyclopedic or excessive gallery of images
154:
There are two main type of heat maps: spatial, and grid.
834:
IEEE Transactions on Visualization and Computer Graphics
1225:"Choropleth vs. Heat Map « Cartographer's Toolkit"
275:
geographical visualization are sometimes confused with
425:
visualizing United States population density by state.
378:
spreadsheet limited to 1000 points of geographic data.
30:"Colormap" redirects here. For indexed palettes, see
1476:Journal of Computational and Graphical Statistics
948:"Using R to draw a heat map from Microarray Data"
890:Crameri F, Shephard GE, Heron PJ (October 2020).
1453:Advanced Applications: Systat for DOS Version 6
1380:"A computer generated aid for cluster analysis"
1351:Journal of the American Statistical Association
892:"The misuse of colour in science communication"
541:; a heat map representing the magnitude of the
525:information is usually shown using a heat map.
123:developed the first computer program in 1994 (
792:
790:
484:beside adjacent text, in accordance with the
8:
952:Molecular Organisation and Assembly in Cells
1281:Graphic semiotics. Diagrams, networks, maps
647:
645:
478:removing excessive or indiscriminate images
299:Rainbow color maps are a common choice, as
107:. Sneath (1957) displayed the results of a
1415:"The application of computers to taxonomy"
1505:
1487:
1430:
1395:
1331:
1321:
923:
845:
665:
500:Learn how and when to remove this message
1013:"Dave Green's 'cubehelix' colour scheme"
998:"Fusion Tables Help - Create a heat map"
1176:"Heat and tree maps - Highcharts demos"
799:IEEE Computer Graphics and Applications
641:
545:. An alternative visualization is the
511:
1537:"The History of the Cluster Heat Map"
1283:] (in French). Gauthier-Villars.
885:
883:
881:
593:Score of each contiguous region of a
7:
984:"Gnuplot demo script: Heatmaps.dem"
476:Please help improve the section by
209:website analysis are listed below.
626:Data and information visualization
621:Color coding in data visualization
25:
602:
586:
570:
554:
530:
514:
486:Manual of Style on use of images
461:
413:Choropleth maps versus heat maps
1419:Journal of General Microbiology
374:can generate a heat map from a
178:not need to be expressed twice.
1363:10.1080/01621459.1994.10476460
537:Human voice visualized with a
296:proper analysis of said data.
1:
1498:10.1080/10618600.2018.1473780
1076:"Most basic heatmap in d3.js"
1547:Albergotti R (May 7, 2014).
49:values in several conditions
27:Data visualization technique
1151:"Heatmap - Highcharts docs"
1126:"Heat Map Charts - Gallery"
1611:
1590:Numerical function drawing
1027:"ol/layer/Heatmap~Heatmap"
916:10.1038/s41467-020-19160-7
29:
1432:10.1099/00221287-17-1-201
1413:Sneath PH (August 1957).
1384:Communications of the ACM
1245:"Heatmaps vs Choropleths"
1201:"Heatmaps vs Choropleths"
654:The American Statistician
250:Exploratory Data Analysis
1470:Barter RL, Yu B (2018).
1323:10.1073/pnas.95.25.14863
343:Software implementations
41:Heat map generated from
1553:The Wall Street Journal
811:10.1109/MCG.2007.323435
1105:AnyChart Documentation
482:moving relevant images
449:
426:
355:
331:
246:
237:
146:
58:
50:
1397:10.1145/362248.362263
896:Nature Communications
856:10.1109/TVCG.2011.192
676:10.1198/tas.2009.0033
447:
420:
353:
329:
243:
235:
144:
69:) is a 2-dimensional
56:
40:
406:JavaScript libraries
372:Google Fusion Tables
1314:1998PNAS...9514863E
1080:D3.js Graph Gallery
1055:D3.js Graph Gallery
908:2020NatCo..11.5444C
769:. 20 December 2021.
521:Lake effect snow –
301:humans can perceive
1580:Data visualization
1002:support.google.com
783:. 20 January 2020.
755:. 20 January 2020.
450:
427:
356:
332:
310:blackbody spectrum
266:Financial Analysis
247:
238:
147:
130:Software designer
71:data visualization
59:
51:
1462:978-0-13-447285-0
1249:www.standardco.de
1205:www.standardco.de
966:"Draw a Heat Map"
724:978-3-319-33622-0
510:
509:
502:
203:Business Analysis
16:(Redirected from
1602:
1556:
1543:
1541:
1519:
1509:
1491:
1466:
1444:
1434:
1409:
1399:
1378:Ling RL (1973).
1374:
1357:(425): 190–200.
1345:
1335:
1325:
1292:
1259:
1258:
1256:
1255:
1241:
1235:
1234:
1232:
1231:
1221:
1215:
1214:
1212:
1211:
1197:
1191:
1190:
1188:
1186:
1172:
1166:
1165:
1163:
1161:
1147:
1141:
1140:
1138:
1136:
1130:AnyChart Gallery
1122:
1116:
1115:
1113:
1111:
1101:"Heat Map Chart"
1097:
1091:
1090:
1088:
1086:
1072:
1066:
1065:
1063:
1061:
1047:
1041:
1040:
1038:
1037:
1023:
1017:
1016:
1009:
1003:
1001:
994:
988:
987:
980:
974:
973:
962:
956:
955:
944:
938:
937:
927:
887:
876:
875:
849:
829:
823:
822:
794:
785:
784:
777:
771:
770:
763:
757:
756:
749:
743:
742:
735:
729:
728:
708:
702:
701:
694:
688:
687:
669:
649:
606:
590:
574:
565:of the same data
558:
534:
518:
505:
498:
494:
493:
465:
464:
457:
159:spatial heat map
136:financial market
121:Leland Wilkinson
109:cluster analysis
45:data reflecting
21:
1610:
1609:
1605:
1604:
1603:
1601:
1600:
1599:
1560:
1559:
1546:
1539:
1530:
1527:
1522:
1469:
1463:
1447:
1412:
1377:
1348:
1308:(25): 14863–8.
1295:
1271:
1267:
1265:Further reading
1262:
1253:
1251:
1243:
1242:
1238:
1229:
1227:
1223:
1222:
1218:
1209:
1207:
1199:
1198:
1194:
1184:
1182:
1174:
1173:
1169:
1159:
1157:
1149:
1148:
1144:
1134:
1132:
1124:
1123:
1119:
1109:
1107:
1099:
1098:
1094:
1084:
1082:
1074:
1073:
1069:
1059:
1057:
1049:
1048:
1044:
1035:
1033:
1025:
1024:
1020:
1011:
1010:
1006:
996:
995:
991:
982:
981:
977:
964:
963:
959:
946:
945:
941:
889:
888:
879:
840:(12): 2479–88.
831:
830:
826:
796:
795:
788:
779:
778:
774:
765:
764:
760:
751:
750:
746:
737:
736:
732:
725:
710:
709:
705:
696:
695:
691:
667:10.1.1.165.7924
651:
650:
643:
639:
617:
610:
607:
598:
591:
582:
577:Combination of
575:
566:
559:
550:
535:
526:
519:
506:
495:
491:(February 2015)
489:
475:
466:
462:
455:
430:Choropleth maps
415:
345:
321:color gradients
317:color blindness
291:Many different
289:
277:Choropleth maps
196:
152:
97:
47:gene expression
35:
28:
23:
22:
15:
12:
11:
5:
1608:
1606:
1598:
1597:
1592:
1587:
1582:
1577:
1575:Bioinformatics
1572:
1562:
1561:
1558:
1557:
1544:
1526:
1525:External links
1523:
1521:
1520:
1482:(4): 910–922.
1467:
1461:
1445:
1410:
1390:(6): 355–361.
1375:
1346:
1293:
1268:
1266:
1263:
1261:
1260:
1236:
1216:
1192:
1167:
1142:
1117:
1092:
1067:
1042:
1018:
1004:
989:
975:
957:
954:. 26 Nov 2009.
939:
877:
847:10.1.1.309.590
824:
786:
772:
758:
744:
741:. 27 May 2021.
730:
723:
703:
689:
660:(2): 179–184.
640:
638:
635:
634:
633:
628:
623:
616:
613:
612:
611:
608:
601:
599:
597:(not to scale)
592:
585:
583:
576:
569:
567:
560:
553:
551:
547:waterfall plot
536:
529:
527:
520:
513:
508:
507:
469:
467:
460:
454:
451:
423:choropleth map
414:
411:
410:
409:
391:
385:
379:
369:
363:
344:
341:
288:
285:
263:
262:
259:bioinformatics
230:
229:
225:
221:
217:
214:
195:
192:
180:
179:
175:
151:
148:
113:Jacques Bertin
101:Toussaint Loua
96:
93:
43:DNA microarray
26:
24:
14:
13:
10:
9:
6:
4:
3:
2:
1607:
1596:
1593:
1591:
1588:
1586:
1583:
1581:
1578:
1576:
1573:
1571:
1570:Thematic maps
1568:
1567:
1565:
1554:
1550:
1545:
1538:
1534:
1531:Wilkinson L,
1529:
1528:
1524:
1517:
1513:
1508:
1503:
1499:
1495:
1490:
1485:
1481:
1477:
1473:
1468:
1464:
1458:
1454:
1450:
1446:
1442:
1438:
1433:
1428:
1425:(1): 201–26.
1424:
1420:
1416:
1411:
1407:
1403:
1398:
1393:
1389:
1385:
1381:
1376:
1372:
1368:
1364:
1360:
1356:
1352:
1347:
1343:
1339:
1334:
1329:
1324:
1319:
1315:
1311:
1307:
1303:
1299:
1294:
1290:
1286:
1282:
1278:
1274:
1270:
1269:
1264:
1250:
1246:
1240:
1237:
1226:
1220:
1217:
1206:
1202:
1196:
1193:
1181:
1177:
1171:
1168:
1156:
1152:
1146:
1143:
1131:
1127:
1121:
1118:
1106:
1102:
1096:
1093:
1081:
1077:
1071:
1068:
1056:
1052:
1046:
1043:
1032:
1028:
1022:
1019:
1014:
1008:
1005:
999:
993:
990:
985:
979:
976:
971:
967:
961:
958:
953:
949:
943:
940:
935:
931:
926:
921:
917:
913:
909:
905:
901:
897:
893:
886:
884:
882:
878:
873:
869:
865:
861:
857:
853:
848:
843:
839:
835:
828:
825:
820:
816:
812:
808:
804:
800:
793:
791:
787:
782:
776:
773:
768:
762:
759:
754:
748:
745:
740:
734:
731:
726:
720:
716:
715:
707:
704:
700:. 1993-09-01.
699:
693:
690:
685:
681:
677:
673:
668:
663:
659:
655:
648:
646:
642:
636:
632:
629:
627:
624:
622:
619:
618:
614:
605:
600:
596:
589:
584:
580:
573:
568:
564:
563:contour lines
557:
552:
548:
544:
540:
533:
528:
524:
523:weather radar
517:
512:
504:
501:
492:
487:
483:
479:
473:
470:This section
468:
459:
458:
452:
446:
442:
438:
434:
431:
424:
419:
412:
407:
403:
399:
395:
392:
389:
386:
383:
380:
377:
376:Google Sheets
373:
370:
367:
364:
361:
358:
357:
352:
348:
342:
340:
338:
328:
324:
322:
318:
313:
311:
307:
302:
297:
294:
293:color schemes
287:Color schemes
286:
284:
280:
278:
273:
269:
267:
260:
255:
254:
253:
251:
242:
234:
226:
222:
218:
215:
212:
211:
210:
206:
204:
200:
193:
191:
189:
184:
176:
173:
172:
171:
168:
167:grid heat map
163:
160:
155:
149:
143:
139:
137:
133:
132:Cormac Kinney
128:
126:
122:
118:
117:Guttman scale
114:
110:
106:
102:
94:
92:
89:
87:
82:
80:
76:
72:
68:
64:
55:
48:
44:
39:
33:
32:Indexed color
19:
1595:Color scales
1552:
1479:
1475:
1452:
1422:
1418:
1387:
1383:
1354:
1350:
1305:
1301:
1280:
1276:
1252:. Retrieved
1248:
1239:
1228:. Retrieved
1219:
1208:. Retrieved
1204:
1195:
1183:. Retrieved
1179:
1170:
1158:. Retrieved
1154:
1145:
1133:. Retrieved
1129:
1120:
1108:. Retrieved
1104:
1095:
1083:. Retrieved
1079:
1070:
1058:. Retrieved
1054:
1045:
1034:. Retrieved
1030:
1021:
1007:
992:
978:
969:
960:
951:
942:
899:
895:
837:
833:
827:
802:
798:
775:
761:
747:
733:
713:
706:
692:
657:
653:
579:surface plot
496:
490:
471:
439:
435:
428:
382:Dave Green's
346:
333:
314:
298:
290:
281:
272:Geographical
270:
264:
248:
207:
201:
197:
185:
181:
166:
164:
158:
156:
153:
129:
98:
90:
85:
83:
66:
62:
60:
1449:Wilkinson L
1000:. Jan 2018.
902:(1): 5444.
805:(2): 14–7.
631:False color
539:spectrogram
1564:Categories
1533:Friendly M
1489:1512.01524
1455:. SYSTAT.
1254:2022-04-15
1230:2022-04-15
1210:2024-03-15
1185:9 December
1180:Highcharts
1160:9 December
1155:Highcharts
1036:2019-01-01
1031:OpenLayers
637:References
402:Highcharts
388:Openlayers
1585:Usability
1051:"Heatmap"
842:CiteSeerX
684:122792460
662:CiteSeerX
595:dartboard
306:grayscale
79:intensity
18:Heat maps
1516:30911216
1451:(1994).
1441:13475686
1275:(1967).
1273:Bertin J
970:R Manual
934:33116149
864:22034369
819:17388198
615:See also
453:Examples
398:AnyChart
337:printing
245:network.
63:heat map
1507:6430237
1406:8033024
1371:2291215
1342:9843981
1310:Bibcode
1289:2656278
1135:25 July
1110:25 July
1085:25 July
1060:25 July
925:7595127
904:Bibcode
872:2548700
366:Gnuplot
95:History
86:density
67:heatmap
1514:
1504:
1459:
1439:
1404:
1369:
1340:
1330:
1287:
932:
922:
870:
862:
844:
817:
721:
682:
664:
480:or by
125:SYSTAT
1540:(PDF)
1484:arXiv
1402:S2CID
1367:JSTOR
1333:24541
1279:[
868:S2CID
680:S2CID
394:D3.js
224:user.
150:Types
105:Paris
1512:PMID
1457:ISBN
1437:PMID
1338:PMID
1285:OCLC
1187:2019
1162:2019
1137:2020
1112:2020
1087:2020
1062:2020
930:PMID
860:PMID
815:PMID
719:ISBN
543:STFT
404:are
400:and
194:Uses
65:(or
1502:PMC
1494:doi
1427:doi
1392:doi
1359:doi
1328:PMC
1318:doi
920:PMC
912:doi
852:doi
807:doi
672:doi
308:or
228:at.
188:GIS
77:or
75:hue
1566::
1551:.
1535:.
1510:.
1500:.
1492:.
1480:27
1478:.
1474:.
1435:.
1423:17
1421:.
1417:.
1400:.
1388:16
1386:.
1382:.
1365:.
1355:89
1353:.
1336:.
1326:.
1316:.
1306:95
1304:.
1300:.
1247:.
1203:.
1178:.
1153:.
1128:.
1103:.
1078:.
1053:.
1029:.
968:.
950:.
928:.
918:.
910:.
900:11
898:.
894:.
880:^
866:.
858:.
850:.
838:17
836:.
813:.
803:27
801:.
789:^
717:.
678:.
670:.
658:63
656:.
644:^
488:.
421:A
396:,
323:.
165:A
157:A
81:.
61:A
1555:.
1542:.
1518:.
1496::
1486::
1465:.
1443:.
1429::
1408:.
1394::
1373:.
1361::
1344:.
1320::
1312::
1291:.
1257:.
1233:.
1213:.
1189:.
1164:.
1139:.
1114:.
1089:.
1064:.
1039:.
1015:.
986:.
972:.
936:.
914::
906::
874:.
854::
821:.
809::
727:.
686:.
674::
549:.
503:)
497:(
474:.
360:R
34:.
20:)
Text is available under the Creative Commons Attribution-ShareAlike License. Additional terms may apply.