1342:
1310:. The two lines defining the center of the cycle divide the positive orthant into four regions. The figure below indicates with arrows the movement of the economy in each region. For example, the north-western region (high employment, low labor's share in output) the economy is moving north-east (employment is rising, worker's share is increasing). Once it crosses the u* line it will begin moving south-west.
1341:
47:
to generate endogenous cycles in economic activity (output, unemployment and wages) unlike most modern macroeconomic models in which movements in economic aggregates are driven by exogenously assumed shocks. Since
Goodwin's publication in 1967, the model has been extended and applied in various ways.
1079:
925:
840:
674:
1139:
1297:
289:
1330:
As can be seen the
Goodwin model can generate endogenous fluctuations in economic activity without relying on extraneous assumptions of outside shocks, whether on the demand or supply side.
395:
562:
1255:
452:
619:
227:
187:
786:
994:
965:
481:
519:
698:
718:
348:
1202:
1176:
738:
313:
1002:
1356:
According to the
Goodwin model, the wage share is to be expected to lag behind the employment rate. This seems to be the case if only by a small time lag
855:
1428:
1324:
1415:, Dynamic Modeling and Econometrics in Economics and Finance, vol. 29, Cham: Springer International Publishing, pp. 191–208,
1524:
1314:
930:
by the assumption that k and q grow at the same rate by assumption of full utilization of capital and constant returns to scale.
798:
1320:
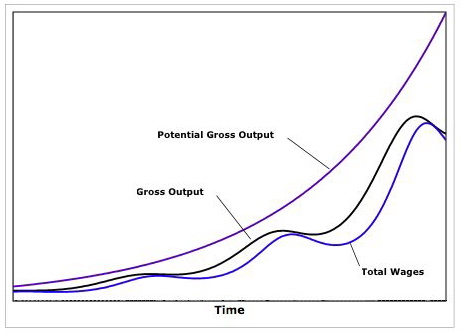
The figure below illustrates the movement of potential output (output at full employment), actual output and wages over time.
627:
1085:
72:
the capital-output ratio is constant (i.e. a fixed amount of output can always be turned into the same amount of capital);
1149:, which are used in biology to model predator-prey interaction. These equations have two fixed points. The first is when
1146:
1261:
354:
The model is then defined by a set of differential equations. Firstly, the change in labour productivity is defined by
1306:
Since the model cannot be solved explicitly, it is instructive to analyze the trajectory of the economy in terms of a
243:
118:
which are all functions of time (although the time subscripts have been suppressed for convenience) and the constants
1501:- Elements for a Synthesis of Marx, Keynes and Schumpeter. Second edition, Springer Verlag Berlin 2010. Chapter 4.3.
360:
527:
1514:
1213:
1519:
1407:
Orlando, Giuseppe; Sportelli, Mario (2021), Orlando, Giuseppe; Pisarchik, Alexander N.; Stoop, Ruedi (eds.),
404:
1491:
571:
1377:
792:
as the surplus is assumed to be completely invested by the capitalist. Lastly, output changes according to
153:
A number of derived quantities are helpful to define the model. The amount of employed labour is given by
744:' (employment is already high) there is upward pressure on wages and vice versa in a 'lax' labor market.
680:
that is, the real wage change curve is modelled as linear. Note that to correctly model the assumptions,
199:
159:
753:
1413:
Nonlinearities in
Economics: An Interdisciplinary Approach to Economic Dynamics, Growth and Cycles
1372:
36:
970:
941:
457:
486:
1424:
1382:
683:
40:
1458:
1449:
Veneziani, Roberto; Mohun, Simon (2006). "Structural stability and
Goodwin's growth cycle".
1416:
741:
703:
321:
1351:
35:, is a model of endogenous economic fluctuations first proposed by the American economist
1181:
1155:
1074:{\displaystyle {\dot {v}}=v(-{\frac {1}{\sigma }}u+{\frac {1}{\sigma }}-\alpha -\beta )}
69:
workers completely consume their wages, and capitalists completely invest their profits;
1387:
1367:
723:
298:
76:
44:
1508:
1462:
920:{\displaystyle {\frac {\dot {q}}{q}}={\frac {\dot {k}}{k}}={\frac {1-u}{\sigma }}}
60:
there is steady growth of labour productivity (e.g. by technological improvement);
1420:
1307:
1408:
1323:
1347:
234:
17:
1479:
Goodwin, Richard M. (1967), "A Growth Cycle", in C.H. Feinstein, editor,
1409:"Growth and Cycles as a Struggle: Lotka–Volterra, Goodwin and Phillips"
1313:
1303:
which determines the center of a family of cyclic trajectories.
1145:
These are the key equations of the model and in fact are the
143: is also used to define the real wage change curve
66:
there are only two factors of production: labour and capital;
1322:
1312:
63:
there is steady growth of the labour force (e.g. by births);
835:{\displaystyle {\frac {\dot {q}}{q}}={\frac {s}{\sigma }}}
137: is used to define the real wage change curve
125: is the rate of growth of labour productivity
720:
must be picked to ensure that real wages increase when
131: is the rate of growth of the labour force
1264:
1216:
1184:
1158:
1088:
1005:
973:
944:
858:
801:
756:
726:
706:
686:
669:{\displaystyle {\frac {\dot {w}}{w}}=-\gamma +\rho v}
630:
574:
530:
489:
460:
407:
363:
324:
301:
246:
202:
162:
56:
The model is derived from the following assumptions:
1134:{\displaystyle {\dot {u}}=u(\rho v-\gamma -\alpha )}
740:
is near 1. In other words, if the labor market is '
1292:{\displaystyle v={\frac {\gamma +\alpha }{\rho }}}
1291:
1249:
1196:
1170:
1133:
1073:
988:
959:
919:
834:
780:
732:
712:
692:
668:
613:
556:
513:
475:
446:
389:
342:
307:
283:
221:
181:
79:, where wages rise when close to full employment.
846:that is, in proportion to the surplus invested.
295:and the share of the capitalists in the output (
284:{\displaystyle u={\frac {wl}{q}}={\frac {w}{a}}}
996:, which gives the two differential equations
390:{\displaystyle {\frac {\dot {a}}{a}}=\alpha }
8:
557:{\displaystyle {\frac {\dot {n}}{n}}=\beta }
75:real wages change according to a linearized
1250:{\displaystyle u=1-(\alpha +\beta )\sigma }
1481:Socialism, Capitalism and Economic Growth
1271:
1263:
1215:
1183:
1157:
1090:
1089:
1087:
1046:
1030:
1007:
1006:
1004:
975:
974:
972:
946:
945:
943:
938:The defining equations can be solved for
899:
881:
879:
861:
859:
857:
822:
804:
802:
800:
758:
757:
755:
725:
705:
685:
633:
631:
629:
602:
592:
579:
573:
533:
531:
529:
521:.) The labour force changes according to
503:
498:
490:
488:
462:
461:
459:
435:
425:
412:
406:
366:
364:
362:
323:
300:
271:
253:
245:
209:
201:
169:
161:
1483:. Cambridge: Cambridge University Press.
149: is the capital-output ratio.
1451:Structural Change and Economic Dynamics
1399:
1337:
447:{\displaystyle a_{t}=a_{0}e^{\alpha t}}
614:{\displaystyle n_{t}=n_{0}e^{\beta t}}
7:
96: is (homogeneous) capital
39:in 1967. It combines aspects of the
108: is labour productivity
25:
621:. Real wages change according to
193:the employment ratio is given by
1340:
222:{\displaystyle v={\frac {l}{n}}}
182:{\displaystyle l={\frac {q}{a}}}
1499:The Macrodynamics of Capitalism
1354:(red line) in the United States
114: is the labour force
1241:
1229:
1128:
1107:
1068:
1024:
33:Goodwin's class struggle model
1:
1463:10.1016/j.strueco.2006.08.003
781:{\displaystyle {\dot {k}}=qs}
747:Capital changes according to
401:that is, steady growth, with
83:The model uses the variables
1421:10.1007/978-3-030-70982-2_14
483:is the derivative over time
235:workers' share in the output
102: is the wage rate
1352:employment population ratio
568:again, steady growth, with
1541:
989:{\displaystyle {\dot {v}}}
960:{\displaystyle {\dot {u}}}
476:{\displaystyle {\dot {x}}}
1488:Chaotic Economic Dynamics
1350:(blue line) and civilian
514:{\displaystyle {dx}/{dt}}
315:for surplus) is given by
1147:Lotka–Volterra equations
1525:Business cycle theories
1492:Oxford University Press
1207:and the second is when
693:{\displaystyle \gamma }
1327:
1317:
1293:
1251:
1198:
1172:
1135:
1075:
990:
961:
921:
836:
782:
734:
714:
694:
670:
615:
558:
515:
477:
448:
391:
344:
309:
285:
223:
183:
43:growth model with the
1486:Goodwin, Richard M.,
1326:
1316:
1294:
1252:
1199:
1173:
1136:
1076:
991:
962:
922:
837:
783:
735:
715:
713:{\displaystyle \rho }
695:
671:
616:
559:
516:
478:
449:
392:
345:
343:{\displaystyle s=1-u}
310:
286:
224:
184:
90: is output
1262:
1214:
1182:
1156:
1086:
1003:
971:
942:
856:
799:
754:
724:
704:
684:
628:
572:
528:
487:
458:
405:
361:
322:
299:
244:
200:
160:
1197:{\displaystyle v=0}
1171:{\displaystyle u=0}
31:, sometimes called
1378:Harrod–Domar model
1373:Richard M. Goodwin
1328:
1318:
1289:
1247:
1194:
1168:
1131:
1071:
986:
957:
917:
832:
778:
730:
710:
690:
666:
611:
554:
511:
473:
444:
387:
340:
305:
281:
219:
179:
37:Richard M. Goodwin
1497:Flaschel, Peter,
1430:978-3-030-70982-2
1383:Marxian economics
1287:
1098:
1054:
1038:
1015:
983:
954:
915:
894:
889:
874:
869:
830:
817:
812:
766:
733:{\displaystyle v}
646:
641:
546:
541:
470:
379:
374:
308:{\displaystyle s}
279:
266:
217:
177:
16:(Redirected from
1532:
1515:Economics models
1467:
1466:
1446:
1440:
1439:
1438:
1437:
1404:
1344:
1298:
1296:
1295:
1290:
1288:
1283:
1272:
1256:
1254:
1253:
1248:
1203:
1201:
1200:
1195:
1177:
1175:
1174:
1169:
1140:
1138:
1137:
1132:
1100:
1099:
1091:
1080:
1078:
1077:
1072:
1055:
1047:
1039:
1031:
1017:
1016:
1008:
995:
993:
992:
987:
985:
984:
976:
966:
964:
963:
958:
956:
955:
947:
926:
924:
923:
918:
916:
911:
900:
895:
890:
882:
880:
875:
870:
862:
860:
841:
839:
838:
833:
831:
823:
818:
813:
805:
803:
787:
785:
784:
779:
768:
767:
759:
739:
737:
736:
731:
719:
717:
716:
711:
699:
697:
696:
691:
675:
673:
672:
667:
647:
642:
634:
632:
620:
618:
617:
612:
610:
609:
597:
596:
584:
583:
563:
561:
560:
555:
547:
542:
534:
532:
520:
518:
517:
512:
510:
502:
497:
482:
480:
479:
474:
472:
471:
463:
453:
451:
450:
445:
443:
442:
430:
429:
417:
416:
396:
394:
393:
388:
380:
375:
367:
365:
349:
347:
346:
341:
314:
312:
311:
306:
290:
288:
287:
282:
280:
272:
267:
262:
254:
228:
226:
225:
220:
218:
210:
188:
186:
185:
180:
178:
170:
21:
1540:
1539:
1535:
1534:
1533:
1531:
1530:
1529:
1520:Economic growth
1505:
1504:
1476:
1471:
1470:
1448:
1447:
1443:
1435:
1433:
1431:
1406:
1405:
1401:
1396:
1364:
1357:
1355:
1345:
1336:
1273:
1260:
1259:
1212:
1211:
1180:
1179:
1154:
1153:
1084:
1083:
1001:
1000:
969:
968:
940:
939:
936:
901:
854:
853:
797:
796:
752:
751:
722:
721:
702:
701:
682:
681:
626:
625:
598:
588:
575:
570:
569:
526:
525:
485:
484:
456:
455:
431:
421:
408:
403:
402:
359:
358:
320:
319:
297:
296:
255:
242:
241:
198:
197:
158:
157:
54:
23:
22:
15:
12:
11:
5:
1538:
1536:
1528:
1527:
1522:
1517:
1507:
1506:
1503:
1502:
1495:
1484:
1475:
1472:
1469:
1468:
1457:(4): 437–451.
1441:
1429:
1398:
1397:
1395:
1392:
1391:
1390:
1388:Phillips curve
1385:
1380:
1375:
1370:
1368:Business cycle
1363:
1360:
1359:
1358:
1346:
1339:
1335:
1332:
1301:
1300:
1286:
1282:
1279:
1276:
1270:
1267:
1257:
1246:
1243:
1240:
1237:
1234:
1231:
1228:
1225:
1222:
1219:
1205:
1204:
1193:
1190:
1187:
1167:
1164:
1161:
1143:
1142:
1130:
1127:
1124:
1121:
1118:
1115:
1112:
1109:
1106:
1103:
1097:
1094:
1081:
1070:
1067:
1064:
1061:
1058:
1053:
1050:
1045:
1042:
1037:
1034:
1029:
1026:
1023:
1020:
1014:
1011:
982:
979:
953:
950:
935:
932:
928:
927:
914:
910:
907:
904:
898:
893:
888:
885:
878:
873:
868:
865:
844:
843:
829:
826:
821:
816:
811:
808:
790:
789:
777:
774:
771:
765:
762:
729:
709:
689:
678:
677:
665:
662:
659:
656:
653:
650:
645:
640:
637:
608:
605:
601:
595:
591:
587:
582:
578:
566:
565:
553:
550:
545:
540:
537:
509:
506:
501:
496:
493:
469:
466:
441:
438:
434:
428:
424:
420:
415:
411:
399:
398:
386:
383:
378:
373:
370:
352:
351:
339:
336:
333:
330:
327:
304:
293:
292:
278:
275:
270:
265:
261:
258:
252:
249:
231:
230:
216:
213:
208:
205:
191:
190:
176:
173:
168:
165:
151:
150:
144:
138:
132:
126:
116:
115:
109:
103:
97:
91:
81:
80:
77:Phillips curve
73:
70:
67:
64:
61:
53:
50:
45:Phillips curve
24:
14:
13:
10:
9:
6:
4:
3:
2:
1537:
1526:
1523:
1521:
1518:
1516:
1513:
1512:
1510:
1500:
1496:
1493:
1489:
1485:
1482:
1478:
1477:
1473:
1464:
1460:
1456:
1452:
1445:
1442:
1432:
1426:
1422:
1418:
1414:
1410:
1403:
1400:
1393:
1389:
1386:
1384:
1381:
1379:
1376:
1374:
1371:
1369:
1366:
1365:
1361:
1353:
1349:
1343:
1338:
1333:
1331:
1325:
1321:
1315:
1311:
1309:
1308:phase diagram
1304:
1284:
1280:
1277:
1274:
1268:
1265:
1258:
1244:
1238:
1235:
1232:
1226:
1223:
1220:
1217:
1210:
1209:
1208:
1191:
1188:
1185:
1165:
1162:
1159:
1152:
1151:
1150:
1148:
1125:
1122:
1119:
1116:
1113:
1110:
1104:
1101:
1095:
1092:
1082:
1065:
1062:
1059:
1056:
1051:
1048:
1043:
1040:
1035:
1032:
1027:
1021:
1018:
1012:
1009:
999:
998:
997:
980:
977:
951:
948:
933:
931:
912:
908:
905:
902:
896:
891:
886:
883:
876:
871:
866:
863:
852:
851:
850:
847:
827:
824:
819:
814:
809:
806:
795:
794:
793:
775:
772:
769:
763:
760:
750:
749:
748:
745:
743:
727:
707:
687:
663:
660:
657:
654:
651:
648:
643:
638:
635:
624:
623:
622:
606:
603:
599:
593:
589:
585:
580:
576:
551:
548:
543:
538:
535:
524:
523:
522:
507:
504:
499:
494:
491:
467:
464:
454:. (Note that
439:
436:
432:
426:
422:
418:
413:
409:
384:
381:
376:
371:
368:
357:
356:
355:
337:
334:
331:
328:
325:
318:
317:
316:
302:
276:
273:
268:
263:
259:
256:
250:
247:
240:
239:
238:
236:
214:
211:
206:
203:
196:
195:
194:
174:
171:
166:
163:
156:
155:
154:
148:
145:
142:
139:
136:
133:
130:
127:
124:
121:
120:
119:
113:
110:
107:
104:
101:
98:
95:
92:
89:
86:
85:
84:
78:
74:
71:
68:
65:
62:
59:
58:
57:
51:
49:
46:
42:
38:
34:
30:
29:Goodwin model
19:
18:Goodwin Model
1498:
1487:
1480:
1454:
1450:
1444:
1434:, retrieved
1412:
1402:
1329:
1319:
1305:
1302:
1206:
1144:
937:
929:
848:
845:
791:
746:
679:
567:
400:
353:
294:
237:is given by
232:
192:
152:
146:
140:
134:
128:
122:
117:
111:
105:
99:
93:
87:
82:
55:
41:Harrod–Domar
32:
28:
26:
1509:Categories
1474:References
1436:2022-04-05
1348:Wage share
1334:Statistics
849:Note that
1285:ρ
1281:α
1275:γ
1245:σ
1239:β
1233:α
1227:−
1126:α
1123:−
1120:γ
1117:−
1111:ρ
1096:˙
1066:β
1063:−
1060:α
1057:−
1052:σ
1036:σ
1028:−
1013:˙
981:˙
952:˙
913:σ
906:−
887:˙
867:˙
828:σ
810:˙
764:˙
708:ρ
688:γ
661:ρ
655:γ
652:−
639:˙
604:β
552:β
539:˙
468:˙
437:α
385:α
372:˙
335:−
1362:See also
934:Solution
1494:, 1990.
1427:
1394:Notes
742:tight
52:Model
1425:ISBN
1178:and
967:and
700:and
233:the
27:The
1459:doi
1417:doi
1511::
1490:,
1455:17
1453:.
1423:,
1411:,
1465:.
1461::
1419::
1299:,
1278:+
1269:=
1266:v
1242:)
1236:+
1230:(
1224:1
1221:=
1218:u
1192:0
1189:=
1186:v
1166:0
1163:=
1160:u
1141:.
1129:)
1114:v
1108:(
1105:u
1102:=
1093:u
1069:)
1049:1
1044:+
1041:u
1033:1
1025:(
1022:v
1019:=
1010:v
978:v
949:u
909:u
903:1
897:=
892:k
884:k
877:=
872:q
864:q
842:,
825:s
820:=
815:q
807:q
788:,
776:s
773:q
770:=
761:k
728:v
676:,
664:v
658:+
649:=
644:w
636:w
607:t
600:e
594:0
590:n
586:=
581:t
577:n
564:,
549:=
544:n
536:n
508:t
505:d
500:/
495:x
492:d
465:x
440:t
433:e
427:0
423:a
419:=
414:t
410:a
397:,
382:=
377:a
369:a
350:.
338:u
332:1
329:=
326:s
303:s
291:,
277:a
274:w
269:=
264:q
260:l
257:w
251:=
248:u
229:,
215:n
212:l
207:=
204:v
189:,
175:a
172:q
167:=
164:l
147:σ
141:ρ
135:γ
129:β
123:α
112:n
106:a
100:w
94:k
88:q
20:)
Text is available under the Creative Commons Attribution-ShareAlike License. Additional terms may apply.