67:
1398:
25:
70:
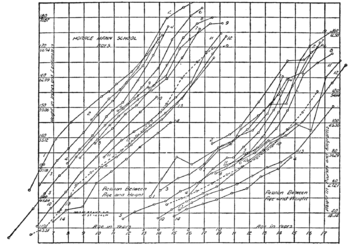
Table of height and weight for boys over time. The growth curve model (also known as GMANOVA) is used to analyze data such as this, where multiple observations are made on collections of individuals over
853:
582:
Ciuonzo, D.; De Maio, A.; Orlando, D. (2016). "A Unifying
Framework for Adaptive Radar Detection in Homogeneous plus Structured Interference-Part I: On the Maximal Invariant Statistic".
238:
846:
635:
Ciuonzo, D.; De Maio, A.; Orlando, D. (2016). "A Unifying
Framework for Adaptive Radar Detection in Homogeneous plus Structured Interference-Part II: Detectors Design".
314:
Many writers have considered the growth curve analysis, among them
Wishart (1938), Box (1950) and Rao (1958). Potthoff and Roy in 1964; were the first in analyzing
326:
GMANOVA is frequently used for the analysis of surveys, clinical trials, and agricultural data, as well as more recently in the context of Radar adaptive detection.
915:
839:
692:. Wiley Series in Probability and Mathematical Statistics: Probability and Mathematical Statistics. New York: John Wiley & Sons, Inc. pp. 325–367.
924:
411:
Kollo, Tõnu; von Rosen, Dietrich (2005). ""Multivariate linear models" (chapter 4), especially "The Growth curve model and extensions" (Chapter 4.1)".
46:
33:
1448:
929:
1362:
756:
420:
395:
1257:
897:
1237:
887:
1443:
1157:
813:
794:
775:
697:
566:
1438:
963:
438:
R.F. Potthoff and S.N. Roy, “A generalized multivariate analysis of variance model useful especially for growth curve problems,”
358:
83:
is a specific multivariate linear model, also known as GMANOVA (Generalized
Multivariate Analysis-Of-Variance). It generalizes
1199:
1433:
343:
66:
1385:
1285:
1275:
1194:
1139:
1412:
1227:
361:. Growth curves have been also applied in forecasting market development. When variables are measured with error, a
907:
38:
1252:
1079:
1012:
350:
1232:
452:
Wishart, John (1938). "Growth rate determinations in nutrition studies with the bacon pig, and their analysis".
1110:
1074:
1002:
892:
874:
973:
335:
1463:
1458:
1326:
1152:
1017:
1007:
958:
713:
Meade, Nigel (1984). "The use of growth curves in forecasting market development—a review and appraisal".
362:
339:
187:
1453:
1407:
1367:
1331:
1316:
1267:
1211:
1038:
1397:
390:. Statistics: Textbooks and Monographs (Second ed.). Boca Raton, Florida: Chapman & Hall/CRC.
1372:
1311:
1298:
1247:
1147:
1069:
1048:
1022:
654:
601:
1390:
1321:
1206:
1173:
1125:
1115:
1094:
1089:
968:
950:
935:
866:
1402:
1306:
1295:
1120:
670:
644:
617:
591:
539:
496:
346:
1357:
1084:
994:
985:
809:
790:
771:
752:
693:
562:
504:
416:
391:
315:
1053:
920:
722:
662:
609:
531:
488:
461:
1336:
1242:
1178:
1183:
831:
658:
605:
1280:
744:
382:
Kim, Kevin; Timm, Neil (2007). ""Restricted MGLM and growth curve model" (Chapter 7)".
522:
Radhakrishna, Rao (1958). "Some statistical methods for comparison of growth curves".
1427:
1352:
882:
862:
770:. Statistics: Textbooks and Monographs. Vol. 145. New York: Marcel Dekker, Inc.
354:
264:
110:
674:
621:
940:
384:
Univariate and multivariate general linear models: Theory and applications with
465:
804:
Timm, Neil H. (2002). ""The general MANOVA model (GMANOVA)" (Chapter 3.6.d)".
80:
751:. Chapman & Hall/CRC Monographs on Statistics & Applied Probability.
666:
613:
726:
508:
24:
479:
Box, G.E.P. (1950). "Problems in the analysis of growth and wear curves".
415:. Mathematics and its applications. Vol. 579. Dordrecht: Springer.
543:
500:
789:. Mathematical Monograph Series. Vol. 8. Beijing: Science Press.
825:
Linear and
Nonlinear Models for the Analysis of Repeated Measurements
299:
84:
688:
Seber, G. A. F.; Wild, C. J. (1989). ""Growth models (Chapter 7)"".
535:
492:
649:
596:
835:
18:
561:. Springer Series in Statistics. New York: Springer-Verlag.
808:. Springer Texts in Statistics. New York: Springer-Verlag.
87:
by allowing post-matrices, as seen in the definition.
190:
1345:
1294:
1266:
1220:
1166:
1138:
1103:
1062:
1031:
993:
982:
949:
906:
873:
766:Kshirsagar, Anant M.; Smith, William Boyce (1995).
232:
823:Vonesh, Edward F.; Chinchilli, Vernon G. (1997).
787:Growth curve models and statistical diagnostics
559:Growth curve models and statistical diagnostics
749:Nonlinear Models for Repeated Measurement Data
413:Advanced multivariate statistics with matrices
847:
8:
340:growth curves such as those used in biology
157:between individual design matrix with rank(
990:
854:
840:
832:
648:
595:
217:
213:
189:
65:
49:of all important aspects of the article.
1363:Numerical smoothing and differentiation
374:
637:IEEE Transactions on Signal Processing
584:IEEE Transactions on Signal Processing
434:
432:
243:defines the growth curve model, where
45:Please consider expanding the lead to
557:Pan, Jian-Xin; Fang, Kai-Tai (2002).
7:
898:Iteratively reweighted least squares
388:(with 1 CD-ROM for Windows and UNIX)
233:{\displaystyle X=ABC+\Sigma ^{1/2}E}
785:Pan, Jianxin; Fang, Kaitai (2007).
113:corresponding to the observations,
916:Pearson product-moment correlation
210:
16:Specific multivariate linear model
14:
359:stochastic differential equations
1396:
23:
1449:Ordinary differential equations
37:may be too short to adequately
47:provide an accessible overview
1:
806:Applied multivariate analysis
1386:Regression analysis category
1276:Response surface methodology
747:; David M. Giltinan (1995).
442:, vol. 51, pp. 313–326, 1964
1258:Frisch–Waugh–Lovell theorem
1228:Mean and predicted response
827:. London: Chapman and Hall.
342:are often modeled as being
298:This differs from standard
1480:
908:Correlation and dependence
318:applying GMANOVA models.
125:within design matrix with
1381:
1253:Minimum mean-square error
1140:Decomposition of variance
1044:Growth curve (statistics)
1013:Generalized least squares
1444:Multivariate time series
1111:Generalized linear model
1003:Simple linear regression
893:Non-linear least squares
875:Computational statistics
667:10.1109/TSP.2016.2519005
614:10.1109/TSP.2016.2519003
466:10.1093/biomet/30.1-2.16
1439:Statistical forecasting
336:mathematical statistics
173:be a positive-definite
1403:Mathematics portal
1327:Orthogonal polynomials
1153:Analysis of covariance
1018:Weighted least squares
1008:Ordinary least squares
959:Ordinary least squares
727:10.1002/for.3980030406
715:Journal of Forecasting
363:Latent growth modeling
234:
72:
1368:System identification
1332:Chebyshev polynomials
1317:Numerical integration
1268:Design of experiments
1212:Regression validation
1039:Polynomial regression
964:Partial least squares
235:
69:
1434:Analysis of variance
1373:Moving least squares
1312:Approximation theory
1248:Studentized residual
1238:Errors and residuals
1233:Gauss–Markov theorem
1148:Analysis of variance
1070:Nonlinear regression
1049:Segmented regression
1023:General linear model
941:Confounding variable
888:Linear least squares
690:Nonlinear regression
347:stochastic processes
188:
1391:Statistics category
1322:Gaussian quadrature
1207:Model specification
1174:Stepwise regression
1032:Predictor structure
969:Total least squares
951:Regression analysis
936:Partial correlation
867:regression analysis
659:2016ITSP...64.2907C
606:2016ITSP...64.2894C
302:by the addition of
1408:Statistics outline
1307:Numerical analysis
306:, a "postmatrix".
230:
145:parameter matrix,
96:Growth curve model
77:growth curve model
73:
1421:
1420:
1413:Statistics topics
1358:Calibration curve
1167:Model exploration
1134:
1133:
1104:Non-normal errors
995:Linear regression
986:statistical model
758:978-0-412-98341-2
643:(99): 2907–2919.
590:(99): 2894–2906.
422:978-1-4020-3418-3
397:978-1-58488-634-1
365:SEM can be used.
316:longitudinal data
259:are unknown, and
64:
63:
1471:
1401:
1400:
1158:Multivariate AOV
1054:Local regression
991:
983:Regression as a
974:Ridge regression
921:Rank correlation
856:
849:
842:
833:
828:
819:
800:
781:
762:
731:
730:
710:
704:
703:
685:
679:
678:
652:
632:
626:
625:
599:
579:
573:
572:
554:
548:
547:
519:
513:
512:
476:
470:
469:
449:
443:
436:
427:
426:
408:
402:
401:
379:
349:, e.g. as being
239:
237:
236:
231:
226:
225:
221:
59:
56:
50:
27:
19:
1479:
1478:
1474:
1473:
1472:
1470:
1469:
1468:
1424:
1423:
1422:
1417:
1395:
1377:
1341:
1337:Chebyshev nodes
1290:
1286:Bayesian design
1262:
1243:Goodness of fit
1216:
1189:
1179:Model selection
1162:
1130:
1099:
1058:
1027:
984:
978:
945:
902:
869:
860:
822:
816:
803:
797:
784:
778:
765:
759:
745:Davidian, Marie
743:
740:
735:
734:
712:
711:
707:
700:
687:
686:
682:
634:
633:
629:
581:
580:
576:
569:
556:
555:
551:
536:10.2307/2527726
521:
520:
516:
493:10.2307/3001781
478:
477:
473:
451:
450:
446:
437:
430:
423:
410:
409:
405:
398:
381:
380:
376:
371:
332:
324:
312:
294:
288:
279:
267:distributed as
209:
186:
185:
93:
60:
54:
51:
44:
32:This article's
28:
17:
12:
11:
5:
1477:
1475:
1467:
1466:
1461:
1456:
1451:
1446:
1441:
1436:
1426:
1425:
1419:
1418:
1416:
1415:
1410:
1405:
1393:
1388:
1382:
1379:
1378:
1376:
1375:
1370:
1365:
1360:
1355:
1349:
1347:
1343:
1342:
1340:
1339:
1334:
1329:
1324:
1319:
1314:
1309:
1303:
1301:
1292:
1291:
1289:
1288:
1283:
1281:Optimal design
1278:
1272:
1270:
1264:
1263:
1261:
1260:
1255:
1250:
1245:
1240:
1235:
1230:
1224:
1222:
1218:
1217:
1215:
1214:
1209:
1204:
1203:
1202:
1197:
1192:
1187:
1176:
1170:
1168:
1164:
1163:
1161:
1160:
1155:
1150:
1144:
1142:
1136:
1135:
1132:
1131:
1129:
1128:
1123:
1118:
1113:
1107:
1105:
1101:
1100:
1098:
1097:
1092:
1087:
1082:
1080:Semiparametric
1077:
1072:
1066:
1064:
1060:
1059:
1057:
1056:
1051:
1046:
1041:
1035:
1033:
1029:
1028:
1026:
1025:
1020:
1015:
1010:
1005:
999:
997:
988:
980:
979:
977:
976:
971:
966:
961:
955:
953:
947:
946:
944:
943:
938:
933:
927:
925:Spearman's rho
918:
912:
910:
904:
903:
901:
900:
895:
890:
885:
879:
877:
871:
870:
861:
859:
858:
851:
844:
836:
830:
829:
820:
814:
801:
795:
782:
776:
763:
757:
739:
736:
733:
732:
721:(4): 429–451.
705:
698:
680:
627:
574:
567:
549:
514:
471:
460:(1–2): 16–28.
444:
428:
421:
403:
396:
373:
372:
370:
367:
331:
328:
323:
320:
311:
308:
290:
284:
271:
241:
240:
229:
224:
220:
216:
212:
208:
205:
202:
199:
196:
193:
161:) +
92:
89:
62:
61:
41:the key points
31:
29:
22:
15:
13:
10:
9:
6:
4:
3:
2:
1476:
1465:
1464:Growth curves
1462:
1460:
1459:Biostatistics
1457:
1455:
1452:
1450:
1447:
1445:
1442:
1440:
1437:
1435:
1432:
1431:
1429:
1414:
1411:
1409:
1406:
1404:
1399:
1394:
1392:
1389:
1387:
1384:
1383:
1380:
1374:
1371:
1369:
1366:
1364:
1361:
1359:
1356:
1354:
1353:Curve fitting
1351:
1350:
1348:
1344:
1338:
1335:
1333:
1330:
1328:
1325:
1323:
1320:
1318:
1315:
1313:
1310:
1308:
1305:
1304:
1302:
1300:
1299:approximation
1297:
1293:
1287:
1284:
1282:
1279:
1277:
1274:
1273:
1271:
1269:
1265:
1259:
1256:
1254:
1251:
1249:
1246:
1244:
1241:
1239:
1236:
1234:
1231:
1229:
1226:
1225:
1223:
1219:
1213:
1210:
1208:
1205:
1201:
1198:
1196:
1193:
1191:
1190:
1182:
1181:
1180:
1177:
1175:
1172:
1171:
1169:
1165:
1159:
1156:
1154:
1151:
1149:
1146:
1145:
1143:
1141:
1137:
1127:
1124:
1122:
1119:
1117:
1114:
1112:
1109:
1108:
1106:
1102:
1096:
1093:
1091:
1088:
1086:
1083:
1081:
1078:
1076:
1075:Nonparametric
1073:
1071:
1068:
1067:
1065:
1061:
1055:
1052:
1050:
1047:
1045:
1042:
1040:
1037:
1036:
1034:
1030:
1024:
1021:
1019:
1016:
1014:
1011:
1009:
1006:
1004:
1001:
1000:
998:
996:
992:
989:
987:
981:
975:
972:
970:
967:
965:
962:
960:
957:
956:
954:
952:
948:
942:
939:
937:
934:
931:
930:Kendall's tau
928:
926:
922:
919:
917:
914:
913:
911:
909:
905:
899:
896:
894:
891:
889:
886:
884:
883:Least squares
881:
880:
878:
876:
872:
868:
864:
863:Least squares
857:
852:
850:
845:
843:
838:
837:
834:
826:
821:
817:
815:0-387-95347-7
811:
807:
802:
798:
796:9780387950532
792:
788:
783:
779:
777:0-8247-9341-2
773:
769:
768:Growth curves
764:
760:
754:
750:
746:
742:
741:
737:
728:
724:
720:
716:
709:
706:
701:
699:0-471-61760-1
695:
691:
684:
681:
676:
672:
668:
664:
660:
656:
651:
646:
642:
638:
631:
628:
623:
619:
615:
611:
607:
603:
598:
593:
589:
585:
578:
575:
570:
568:0-387-95053-2
564:
560:
553:
550:
545:
541:
537:
533:
529:
525:
518:
515:
510:
506:
502:
498:
494:
490:
487:(4): 362–89.
486:
482:
475:
472:
467:
463:
459:
455:
448:
445:
441:
435:
433:
429:
424:
418:
414:
407:
404:
399:
393:
389:
387:
378:
375:
368:
366:
364:
360:
356:
355:almost surely
352:
348:
345:
341:
337:
329:
327:
321:
319:
317:
309:
307:
305:
301:
296:
293:
287:
283:
278:
274:
270:
266:
265:random matrix
262:
258:
254:
250:
246:
227:
222:
218:
214:
206:
203:
200:
197:
194:
191:
184:
183:
182:
181:matrix. Then
180:
176:
172:
168:
165: ≤
164:
160:
156:
152:
148:
144:
140:
136:
132:
129: ≤
128:
124:
120:
116:
112:
111:random matrix
109:
105:
101:
97:
90:
88:
86:
82:
78:
68:
58:
55:November 2018
48:
42:
40:
35:
30:
26:
21:
20:
1454:Exponentials
1346:Applications
1185:
1063:Non-standard
1043:
824:
805:
786:
767:
748:
718:
714:
708:
689:
683:
640:
636:
630:
587:
583:
577:
558:
552:
527:
523:
517:
484:
480:
474:
457:
453:
447:
439:
412:
406:
385:
383:
377:
351:sample paths
333:
325:
322:Applications
313:
303:
297:
291:
285:
281:
276:
272:
268:
260:
256:
252:
248:
244:
242:
178:
174:
170:
166:
162:
158:
154:
150:
146:
142:
138:
134:
130:
126:
122:
118:
114:
107:
103:
99:
95:
94:
76:
74:
52:
36:
34:lead section
530:(1): 1–17.
251:are known,
1428:Categories
1221:Background
1184:Mallows's
738:References
650:1507.05266
597:1507.05263
524:Biometrics
481:Biometrics
454:Biometrika
440:Biometrika
344:continuous
330:Other uses
91:Definition
81:statistics
1296:Numerical
369:Footnotes
211:Σ
39:summarize
1126:Logistic
1116:Binomial
1095:Isotonic
1090:Quantile
675:12069007
509:14791573
169:and let
1121:Poisson
655:Bibcode
622:5473094
602:Bibcode
544:2527726
501:3001781
357:solve
310:History
1085:Robust
812:
793:
774:
755:
696:
673:
620:
565:
542:
507:
499:
419:
394:
300:MANOVA
98:: Let
85:MANOVA
671:S2CID
645:arXiv
618:S2CID
592:arXiv
540:JSTOR
497:JSTOR
353:that
263:is a
102:be a
71:time.
865:and
810:ISBN
791:ISBN
772:ISBN
753:ISBN
694:ISBN
563:ISBN
505:PMID
417:ISBN
392:ISBN
255:and
247:and
75:The
1200:BIC
1195:AIC
723:doi
663:doi
610:doi
532:doi
489:doi
462:doi
386:SAS
334:In
295:).
280:(0,
79:in
1430::
717:.
669:.
661:.
653:.
641:PP
639:.
616:.
608:.
600:.
588:PP
586:.
538:.
528:14
526:.
503:.
495:.
483:.
458:30
456:.
431:^
338:,
149:a
137:a
133:,
117:a
1188:p
1186:C
932:)
923:(
855:e
848:t
841:v
818:.
799:.
780:.
761:.
729:.
725::
719:3
702:.
677:.
665::
657::
647::
624:.
612::
604::
594::
571:.
546:.
534::
511:.
491::
485:6
468:.
464::
425:.
400:.
304:C
292:n
289:,
286:p
282:I
277:n
275:,
273:p
269:N
261:E
257:Σ
253:B
249:C
245:A
228:E
223:2
219:/
215:1
207:+
204:C
201:B
198:A
195:=
192:X
179:p
177:×
175:p
171:Σ
167:n
163:p
159:C
155:n
153:×
151:k
147:C
143:k
141:×
139:q
135:B
131:p
127:q
123:q
121:×
119:p
115:A
108:n
106:×
104:p
100:X
57:)
53:(
43:.
Text is available under the Creative Commons Attribution-ShareAlike License. Additional terms may apply.