| ||||||||||||||||||||||||||||||||||||||||||||||||||||||||||||||
32 of the 96 seats in the United States Senate 49 seats needed for a majority | ||||||||||||||||||||||||||||||||||||||||||||||||||||||||||||||
|---|---|---|---|---|---|---|---|---|---|---|---|---|---|---|---|---|---|---|---|---|---|---|---|---|---|---|---|---|---|---|---|---|---|---|---|---|---|---|---|---|---|---|---|---|---|---|---|---|---|---|---|---|---|---|---|---|---|---|---|---|---|---|
| ||||||||||||||||||||||||||||||||||||||||||||||||||||||||||||||
 Results of the elections: Democratic gain Democratic hold Republican gain Republican hold Farmer–Labor gain No election | ||||||||||||||||||||||||||||||||||||||||||||||||||||||||||||||
| ||||||||||||||||||||||||||||||||||||||||||||||||||||||||||||||
The 1922 United States Senate elections were elections that occurred in the middle of Republican President Warren G. Harding's term. The 32 seats of Class 1 were contested in regular elections, and special elections were held to fill vacancies. With the Republicans divided between conservative and progressive factions, the Democrats gained six net seats from the Republicans while the Farmer–Labor party gained one. The Republicans retained their Senate majority.
Mid-term vacancies would reduce the Republican majority by a further two seats, with the Democrats and the Farmer Labors picking up another seat each, reducing Republicans to a 51-43-2 majority.
Gains, losses, and holds
Retirements
One Republican and two Democrats retired instead of seeking re-election. One Republican retired instead of seeking election to finish the unexpired term and one Democrat retired instead of seeking election to finish the unexpired term.
Defeats
Nine Republicans and three Democrats sought re-election but lost in the primary or general election. One Republican sought election to finish the unexpired term and sought election to a full term but lost in both the special election and the regular election.
Post-elections changes
| State | Senator | Replaced by |
|---|---|---|
| Colorado | Samuel D. Nicholson | Alva B. Adams |
| Illinois | Medill McCormick | Charles S. Deneen |
| Minnesota | Knute Nelson | Magnus Johnson |
Change in composition
Before the elections
At the beginning of 1922.
| D1 | D2 | D3 | D4 | D5 | D6 | D7 | D8 | ||
| D18 | D17 | D16 | D15 | D14 | D13 | D12 | D11 | D10 | D9 |
| D19 | D20 | D21 Ariz. Ran |
D22 Fla. Ran |
D23 Ga. (sp) Retired |
D24 Miss. Retired |
D25 Mo. Ran |
D26 Mont. Retired |
D27 Neb. Ran |
D28 Nev. Ran |
| R59 W.Va. Ran |
R60 Wis. Ran |
D36 Wyo. Ran |
D35 Va. Ran |
D34 Utah Ran |
D33 Texas Ran |
D32 Tenn. Ran |
D31 R.I. Ran |
D30 Ohio Ran |
D29 N.M. Ran |
| R58 Wash. Ran |
R57 Vt. Retired |
R56 Pa. (sp cl.3) Ran |
R55 Pa. (reg) Pa. (sp cl.1) Ran |
R54 N.D. Ran |
R53 N.Y. Ran |
R52 N.J. Ran |
R51 Minn. Ran |
R50 Mich. Ran |
R49 Mass. Ran |
| Majority → | |||||||||
| R39 | R40 | R41 | R42 Calif. Ran |
R43 Conn. Ran |
R44 Del. (reg) Del. (sp) Ran |
R45 Ind. Ran |
R46 Iowa (sp) Retired |
R47 Maine Ran |
R48 Md. Ran |
| R38 | R37 | R36 | R35 | R34 | R33 | R32 | R31 | R30 | R29 |
| R19 | R20 | R21 | R22 | R23 | R24 | R25 | R26 | R27 | R28 |
| R18 | R17 | R16 | R15 | R14 | R13 | R12 | R11 | R10 | R9 |
| R1 | R2 | R3 | R4 | R5 | R6 | R7 | R8 | ||
After the elections
| D1 | D2 | D3 | D4 | D5 | D6 | D7 | D8 | ||
| D18 | D17 | D16 | D15 | D14 | D13 | D12 | D11 | D10 | D9 |
| D19 | D20 | D21 Ariz. Re-elected |
D22 Del. (sp) Del. (reg) Gain |
D23 Fla. Re-elected |
D24 Ga. (sp) Hold |
D25 Ind. Gain |
D26 Md. Gain |
D27 Mich. Gain |
D28 Miss. Hold |
| D38 Utah Re-elected |
D37 Texas Hold |
D36 Tenn. Re-elected |
D35 R.I. Re-elected |
D34 N.Y. Re-elected |
D33 N.M. Re-elected |
D32 N.J. Gain |
D31 Nev. Hold |
D30 Mont. Hold |
D29 Mo. Re-elected |
| D39 Va. Re-elected |
D40 Wash. Gain |
D41 W.Va. Gain |
D42 Wyo. Re-elected |
FL1 Minn. Gain |
R53 Wis. Re-elected |
R52 Vt. Hold |
R51 Ohio Gain |
R50 Pa. (sp cl.3) Elected |
R49 Pa. (sp cl.1) Pa. (reg) Elected |
| Majority → | |||||||||
| R39 | R40 | R41 | R42 Calif. Re-elected |
R43 Conn. Re-elected |
R44 Iowa (sp) Hold |
R45 Maine Re-elected |
R46 Mass. Re-elected |
R47 Neb. Gain |
R48 N.D. Hold |
| R38 | R37 | R36 | R35 | R34 | R33 | R32 | R31 | R30 | R29 |
| R19 | R20 | R21 | R22 | R23 | R24 | R25 | R26 | R27 | R28 |
| R18 | R17 | R16 | R15 | R14 | R13 | R12 | R11 | R10 | R9 |
| R1 | R2 | R3 | R4 | R5 | R6 | R7 | R8 | ||
| Key |
|
|---|
Race summaries
Special elections during the 67th Congress
In these special elections, the winners were seated during 1922; ordered by election date.
| State | Incumbent | Results | Candidates | ||
|---|---|---|---|---|---|
| Senator | Party | Electoral history | |||
| Delaware (Class 1) |
T. Coleman du Pont | Republican | 1921 (Appointed) | Interim appointee lost election. New senator elected November 7, 1922. Democratic gain. Winner also elected to the next term, see below. |
|
| Georgia (Class 3) |
Rebecca Latimer Felton | Democratic | 1922 (Appointed) | Interim appointee retired. New senator elected November 7, 1922. Democratic hold. |
|
| Iowa (Class 2) |
Charles A. Rawson | Republican | 1922 (Appointed) | Interim appointee retired. New senator elected November 7, 1922. Republican hold. |
|
| Pennsylvania (Class 1) |
David A. Reed | Republican | 1922 (Appointed) | Interim appointee elected November 7, 1922. Winner also elected to the next term, see below. |
|
| Pennsylvania (Class 3) |
George W. Pepper | Republican | 1922 (Appointed) | Interim appointee elected November 7, 1922. |
|
Elections leading to the 68th Congress
In these general elections, the winners were elected for the term beginning March 4, 1923; ordered by state.
All of the elections involved the Class 1 seats.
| State | Incumbent | Results | Candidates | ||
|---|---|---|---|---|---|
| Senator | Party | Electoral history | |||
| Arizona | Henry F. Ashurst | Democratic | 1912 (New state) 1916 |
Incumbent re-elected. |
|
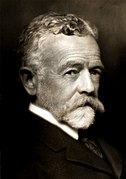
| California | Hiram Johnson | Republican | 1916 | Incumbent re-elected. |
|
| Connecticut | George P. McLean | Republican | 1911 1916 |
Incumbent re-elected. |
|
| Delaware | T. Coleman du Pont | Republican | 1921 (Appointed) | Interim appointee lost election. New senator elected. Democratic gain. |
|
| Florida | Park Trammell | Democratic | 1916 | Incumbent re-elected. |
|
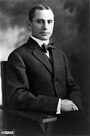
| Indiana | Harry S. New | Republican | 1916 | Incumbent lost renomination. New senator elected. Democratic gain. |
|
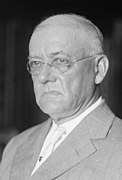
| Maine | Frederick Hale | Republican | 1916 | Incumbent re-elected September 11, 1922. |
|
| Maryland | Joseph I. France | Republican | 1916 | Incumbent lost re-election. New senator elected. Democratic gain. |
|
| Massachusetts | Henry Cabot Lodge | Republican | 1893 1899 1905 1911 1916 |
Incumbent re-elected. |
|
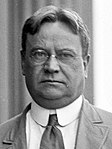
| Michigan | Charles E. Townsend | Republican | 1911 1916 |
Incumbent lost re-election. New senator elected. Democratic gain. |
|
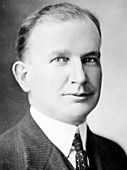
| Minnesota | Frank B. Kellogg | Republican | 1916 | Incumbent lost re-election. New senator elected. Farmer–Labor gain. |
|
| Mississippi | John S. Williams | Democratic | 1908 (Early) 1916 |
Incumbent retired. New senator elected. Democratic hold. |
|
| Missouri | James A. Reed | Democratic | 1911 1916 |
Incumbent re-elected. |
|
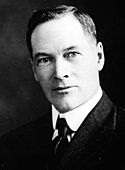
| Montana | Henry L. Myers | Democratic | 1911 1916 |
Incumbent retired. New senator elected. Democratic hold. |
|
| Nebraska | Gilbert Hitchcock | Democratic | 1911 1916 |
Incumbent lost re-election. New senator elected. Republican gain. |
|
| Nevada | Key Pittman | Democratic | 1913 (special) 1916 |
Incumbent re-elected. |
|
| New Jersey | Joseph S. Frelinghuysen | Republican | 1916 | Incumbent lost re-election. New senator elected. Democratic gain. |
|
| New Mexico | Andrieus A. Jones | Democratic | 1916 | Incumbent re-elected. |
|
| New York | William M. Calder | Republican | 1916 | Incumbent lost re-election. New senator elected. Democratic gain. |
|
| North Dakota | Porter J. McCumber | Republican | 1899 1905 1911 1916 |
Incumbent lost renomination. New senator elected. Republican hold. |
|
| Ohio | Atlee Pomerene | Democratic | 1911 1916 |
Incumbent lost re-election. New senator elected. Republican gain. |
|
| Pennsylvania | David A. Reed | Republican | 1922 (Appointed) | Interim appointee elected. Winner was also elected to finish the current term, see above. |
|
| Rhode Island | Peter G. Gerry | Democratic | 1916 | Incumbent re-elected. |
|
| Tennessee | Kenneth McKellar | Democratic | 1916 | Incumbent re-elected. |
|
| Texas | Charles A. Culberson | Democratic | 1899 1905 1911 1916 |
Incumbent lost renomination. New senator elected. Democratic hold. |
|
| Utah | William H. King | Democratic | 1916 | Incumbent re-elected. |
|
| Vermont | Carroll S. Page | Republican | 1908 (special) 1910 1916 |
Incumbent retired. New senator elected. Republican hold. |
|
| Virginia | Claude A. Swanson | Democratic | 1910 (Appointed) 1911 (Appointed) 1912 (special) 1916 |
Incumbent re-elected. |
|
| Washington | Miles Poindexter | Republican | 1910 1916 |
Incumbent lost re-election. New senator elected. Democratic gain. |
|
| West Virginia | Howard Sutherland | Republican | 1916 | Incumbent lost re-election. New senator elected. Democratic gain. |
|
| Wisconsin | Robert M. La Follette | Republican | 1905 1911 1916 |
Incumbent re-elected. |
|
| Wyoming | John B. Kendrick | Democratic | 1916 | Incumbent re-elected. |
|
Closest races
Fourteen races had a margin of victory under 10%:
| State | Party of winner | Margin |
|---|---|---|
| Delaware (special) | Democratic (flip) | 0.1% |
| Delaware (regular) | Democratic (flip) | 0.43% |
| Utah | Democratic | 0.47% |
| Massachusetts | Republican | 0.8% |
| Washington | Democratic (flip) | 1.2% |
| Michigan | Democratic (flip) | 2.2% |
| Indiana | Democratic (flip) | 3.1% |
| Ohio | Republican (flip) | 3.2% |
| West Virginia | Democratic (flip) | 3.6% |
| North Dakota | Republican | 4.56% |
| Missouri | Democratic | 4.6% |
| Maryland | Democratic (flip) | 7.0% |
| Connecticut | Republican | 6.8% |
| Rhode Island | Democratic | 8.8% |
The tipping point state is Pennsylvania with a margin of 25.5%.
Arizona
| |||||||||||||||||
| |||||||||||||||||
 County results Ashurst: 50–60% 60–70% 70–80% | |||||||||||||||||
| |||||||||||||||||


| Party | Candidate | Votes | % | |
|---|---|---|---|---|
| Democratic | Henry F. Ashurst (Incumbent) | 39,722 | 65.03% | |
| Republican | James H. McClintock | 21,358 | 34.97% | |
| Majority | 13,864 | 30.06% | ||
| Turnout | 61,080 | |||
| Democratic hold | ||||
California
| |||||||||||||||||||||||||||||||||||||
| |||||||||||||||||||||||||||||||||||||
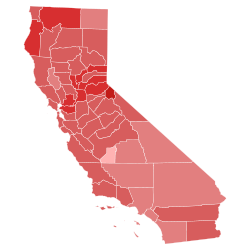 County results Johnson: 40-50% 50-60% 60-70% 70-80% 80–90% | |||||||||||||||||||||||||||||||||||||
| |||||||||||||||||||||||||||||||||||||


| Party | Candidate | Votes | % | |
|---|---|---|---|---|
| Republican | Hiram Johnson (Incumbent) | 564,422 | 62.17% | |
| Democratic | William J. Pearson | 215,748 | 23.76% | |
| Independent | H. Clay Needham | 70,748 | 7.79% | |
| Socialist | Upton Sinclair | 56,982 | 6.28% | |
| Majority | 348,674 | 38.41% | ||
| Turnout | 907,900 | |||
| Republican hold | ||||
Connecticut
| |||||||||||||||||
| |||||||||||||||||
 County results
 Municipality results
McLean: 40-50% 50-60% 60-70% 70-80% 80-90% 90-100% Spellacy: 40–50% 50–60% 60-70% | |||||||||||||||||
| |||||||||||||||||


| Party | Candidate | Votes | % | |
|---|---|---|---|---|
| Republican | George P. McLean (Incumbent) | 169,524 | 52.49% | |
| Democratic | Thomas J. Spellacy | 147,276 | 45.60% | |
| Socialist | Isadore Polsky | 6,161 | 1.91% | |
| Majority | 22,248 | 6.89% | ||
| Turnout | 322,961 | |||
| Republican hold | ||||
Delaware
There were 2 elections in Delaware.
Delaware (special)
| |||||||||||||||||
| |||||||||||||||||
| |||||||||||||||||


| Party | Candidate | Votes | % | |
|---|---|---|---|---|
| Democratic | Thomas F. Bayard Jr. | 36,954 | 49.65% | |
| Republican | T. Coleman du Pont (Incumbent) | 36,894 | 49.57% | |
| Forward | Frank Stephens | 581 | 0.78% | |
| Majority | 60 | 0.08% | ||
| Turnout | 74,429 | |||
| Democratic gain from Republican | ||||
Delaware (regular)
| |||||||||||||||||
| |||||||||||||||||
 County results Bayard: 50-60% Pont: 50-60% | |||||||||||||||||
| |||||||||||||||||
| Party | Candidate | Votes | % | |
|---|---|---|---|---|
| Democratic | Thomas F. Bayard Jr. | 37,304 | 49.81% | |
| Republican | T. Coleman du Pont (Incumbent) | 36,979 | 49.38% | |
| Forward | Frank Stephens | 608 | 0.81% | |
| Majority | 325 | 0.43% | ||
| Turnout | 74,891 | |||
| Democratic gain from Republican | ||||
Florida
| |||||||||||||||||
| |||||||||||||||||
 County results Trammell: 70-80% 80-90% >90% | |||||||||||||||||
| |||||||||||||||||


| Party | Candidate | Votes | % | |
|---|---|---|---|---|
| Democratic | Park Trammell (Incumbent) | 45,707 | 88.27% | |
| Independent Republican | W. C. Lawson | 6,074 | 11.73% | |
| Majority | 39,733 | 76.54% | ||
| Turnout | 51,781 | |||
| Democratic hold | ||||
Georgia (special)
| |||||||||||||||||||||
| |||||||||||||||||||||
| |||||||||||||||||||||


| Party | Candidate | Votes | % | |
|---|---|---|---|---|
| Democratic | Walter F. George | 60,436 | 54.64% | |
| Democratic | Thomas W. Hardwick | 36,328 | 32.85% | |
| Democratic | Seaborn Wright | 12,820 | 11.59% | |
| Democratic | John R. Cooper | 1,018 | 0.92% | |
| Majority | 24,108 | 21.79% | ||
| Turnout | 110,602 | |||
| Democratic hold | ||||
In the special general election held November 7, 1922, George was unopposed.
Indiana
| |||||||||||||||||
| |||||||||||||||||
 County results Ralston: 40–50% 50–60% 60–70% Beveridge: 40–50% 50–60% 60–70% | |||||||||||||||||
| |||||||||||||||||


| Party | Candidate | Votes | % | |
|---|---|---|---|---|
| Democratic | Samuel M. Ralston | 558,169 | 51.55% | |
| Republican | Albert J. Beveridge | 524,558 | 48.45% | |
| Majority | 33,611 | 3.10% | ||
| Turnout | 1,082,727 | |||
| Democratic gain from Republican | ||||
Iowa (special)
| |||||||||||||||||
| |||||||||||||||||
 County results Brookhart: 50–60% 60–70% 70–80% 80–90% Herring: 50–60% | |||||||||||||||||
| |||||||||||||||||


| Party | Candidate | Votes | % | |
|---|---|---|---|---|
| Republican | Smith W. Brookhart | 389,751 | 63.11% | |
| Democratic | Clyde L. Herring | 227,833 | 36.89% | |
| Majority | 161,918 | 27.22% | ||
| Turnout | 617,584 | |||
| Republican hold | ||||
Maine
| |||||||||||||||||
| |||||||||||||||||
 County Results Hale: 50–60% 60–70% 70–80% Curtis: 50–60% | |||||||||||||||||
| |||||||||||||||||


| Party | Candidate | Votes | % | |
|---|---|---|---|---|
| Republican | Frederick Hale (Incumbent) | 101,026 | 57.50% | |
| Democratic | Oakley C. Curtis | 74,660 | 42.50% | |
| Majority | 26,366 | 15.00% | ||
| Turnout | 175,686 | |||
| Republican hold | ||||
Maryland
| |||||||||||||||||
| |||||||||||||||||
 County results France: 40–50% 50–60% Bruce: 50–60% 60–70% | |||||||||||||||||
| |||||||||||||||||


| Party | Candidate | Votes | % | |
|---|---|---|---|---|
| Democratic | William Cabell Bruce | 160,947 | 52.61% | |
| Republican | Joseph I. France (Incumbent) | 139,581 | 45.63% | |
| Labor | Robert E. Long | 2,909 | 0.95% | |
| Socialist | James L. Smiley | 2,479 | 0.81% | |
| Majority | 21,366 | 6.98% | ||
| Turnout | 305,916 | |||
| Democratic gain from Republican | ||||
Massachusetts
| |||||||||||||||||
| |||||||||||||||||
 County results
 Municipality results
Lodge: 40–50% 50–60% 60–70% 70–80% 80–90% 90–100% Gaston: 40–50% 50–60% 60–70% 70–80% | |||||||||||||||||
| |||||||||||||||||


| Party | Candidate | Votes | % | |
|---|---|---|---|---|
| Republican | Henry Cabot Lodge (Incumbent) | 414,130 | 47.59% | |
| Democratic | William A. Gaston | 406,776 | 46.75% | |
| Prohibition | John A. Nichols | 24,866 | 2.86% | |
| Socialist | John Weaver Sherman | 11,678 | 1.34% | |
| Independent | Washington Cook | 7,836 | 0.90% | |
| Progressive | William E. Weeks | 4,862 | 0.56% | |
| Majority | 7,354 | 0.84% | ||
| Turnout | 870,148 | |||
| Republican hold | ||||
Michigan
| |||||||||||||||||
| |||||||||||||||||
 County results Ferris: 40–50% 50–60% 60–70% Townsend: 40–50% 50–60% 60–70% 70–80% 80–90% | |||||||||||||||||
| |||||||||||||||||

| Party | Candidate | Votes | % | |
|---|---|---|---|---|
| Democratic | Woodbridge N. Ferris | 294,932 | 50.59% | |
| Republican | Charles E. Townsend (Incumbent) | 281,843 | 48.35% | |
| Socialist | William L. Krieghoff | 4,249 | 0.73% | |
| Prohibition | Frank E. Titus | 1,936 | 0.33% | |
| Majority | 13,089 | 2.24% | ||
| Turnout | 582,960 | |||
| Democratic hold | ||||
Minnesota
| |||||||||||||||||||||
| |||||||||||||||||||||
 County results Shipstead: 30–40% 40–50% 50–60% 60–70% 70–80% Kellogg: 30–40% 40–50% 50–60% Olesen: 40–50% | |||||||||||||||||||||
| |||||||||||||||||||||


| Party | Candidate | Votes | % | |
|---|---|---|---|---|
| Farmer–Labor | Henrik Shipstead | 325,372 | 47.10% | |
| Republican | Frank B. Kellogg (Incumbent) | 241,833 | 35.01% | |
| Democratic | Anna Dickie Olesen | 123,624 | 17.90% | |
| Majority | 83,539 | 12.09% | ||
| Turnout | 690,829 | |||
| Farmer–Labor gain from Republican | ||||
Mississippi
| |||||||||||||||||
| |||||||||||||||||
| |||||||||||||||||


| Party | Candidate | Votes | % | |
|---|---|---|---|---|
| Democratic | Hubert D. Stephens | 63,639 | 92.84% | |
| Republican | John C. Cook | 3,632 | 5.30% | |
| Socialist | Sumner W. Rose | 1,273 | 1.86% | |
| Majority | 60007 | 87.54% | ||
| Turnout | 68544 | |||
| Democratic hold | ||||
Missouri
| |||||||||||||||||
| |||||||||||||||||
 Results by county Reed: 40–50% 50–60% 60–70% 70–80% Brewster: 40–50% 50–60% 60–70% 70–80% | |||||||||||||||||
| |||||||||||||||||


| Party | Candidate | Votes | % | |
|---|---|---|---|---|
| Democratic | James A. Reed (Incumbent) | 506,264 | 51.85% | |
| Republican | R. R. Brewster | 462,009 | 47.32% | |
| Socialist | W. M. Brandt | 7,119 | 0.73% | |
| Socialist Labor | William Wesley Cox | 970 | 0.10% | |
| Majority | 44,255 | 4.53% | ||
| Turnout | 976,362 | |||
| Democratic hold | ||||
Montana
| |||||||||||||||||
| |||||||||||||||||
 County Results Wheeler: 40–50% 50–60% 60–70% 70–80% Riddick: 40–50% 50–60% 60–70% 70–80% | |||||||||||||||||
| |||||||||||||||||
| Party | Candidate | Votes | % | |
|---|---|---|---|---|
| Democratic | Burton K. Wheeler (Incumbent) | 88,205 | 55.57% | |
| Republican | Carl W. Riddick | 69,464 | 43.76% | |
| Socialist | George H. Ambrose | 1,068 | 0.67% | |
| Majority | 18,741 | 11.81% | ||
| Turnout | 158,737 | |||
| Democratic hold | ||||
Nebraska
| |||||||||||||||||
| |||||||||||||||||
 County results Howell: 40-50% 50-60% 60-70% 70-80% Hitchcock: 40-50% 50-60% | |||||||||||||||||
| |||||||||||||||||

| Party | Candidate | Votes | % | |
|---|---|---|---|---|
| Republican | Robert B. Howell | 220,350 | 56.84% | |
| Democratic | Gilbert Hitchcock (Incumbent) | 148,265 | 38.24% | |
| Progressive | James L. Beebe | 19,076 | 4.92% | |
| Majority | 72,085 | 18.60% | ||
| Turnout | 387,691 | |||
| Republican gain from Democratic | ||||
Nevada
| |||||||||||||||||
| |||||||||||||||||
 County Results Pittman: 50–60% 60–70% 70–80% Chandler: 50–60% 60–70% | |||||||||||||||||
| |||||||||||||||||

| Party | Candidate | Votes | % | |
|---|---|---|---|---|
| Democratic | Key Pittman (Incumbent) | 18,200 | 63.04% | |
| Republican | Charles S. Chandler | 10,671 | 36.96% | |
| Majority | 7,529 | 26.08% | ||
| Turnout | 28,871 | |||
| Democratic hold | ||||
New Jersey
| |||||||||||||||||
| |||||||||||||||||
 County results Edwards: 50–60% 70–80% Frelinghuysen: 40–50% 50–60% 60–70% | |||||||||||||||||
| |||||||||||||||||

| Party | Candidate | Votes | % | |
|---|---|---|---|---|
| Democratic | Edward I. Edwards | 451,832 | 55.47% | |
| Republican | Joseph S. Frelinghuysen Sr. (Incumbent) | 362,699 | 44.53% | |
| Majority | 89,133 | 10.94% | ||
| Turnout | 814,531 | |||
| Democratic gain from Republican | ||||
New Mexico
| |||||||||||||||||
| |||||||||||||||||
 County results Jones: 50–60% 60–70% 70–80% 80–90% Davis: 50–60% 60–70% 70–80% | |||||||||||||||||
| |||||||||||||||||

| Party | Candidate | Votes | % | |
|---|---|---|---|---|
| Democratic | Andrieus A. Jones (Incumbent) | 60,969 | 55.58% | |
| Republican | Stephen B. Davis, Jr. | 48,721 | 44.42% | |
| Majority | 12,248 | 11.16% | ||
| Turnout | 109,690 | |||
| Democratic hold | ||||
New York
| |||||||||||||||||
| |||||||||||||||||
 County Results Copeland: 40–50% 50–60% 60–70% 70–80% Calder: 40–50% 50–60% 60–70% | |||||||||||||||||
| |||||||||||||||||


| Party | Candidate | Votes | % | |
|---|---|---|---|---|
| Democratic | Royal S. Copeland | 1,276,667 | 52.60% | |
| Republican | William M. Calder (Incumbent) | 995,421 | 41.01% | |
| Socialist | Algernon Lee | 117,928 | 4.86% | |
| Prohibition | Coleridge A. Hart | 32,124 | 1.32% | |
| Socialist Labor | Henry Kuhn | 4,993 | 0.21% | |
| Majority | 281,246 | 11.59% | ||
| Turnout | 2,427,133 | |||
| Democratic gain from Republican | ||||
North Dakota
| |||||||||||||||||
| |||||||||||||||||
 County Results Frazier: 50–60% 60–70% 70–80% 80–90% O'Connor: 50–60% 60–70% | |||||||||||||||||
| |||||||||||||||||


| Party | Candidate | Votes | % | |
|---|---|---|---|---|
| Republican | Lynn Frazier | 101,312 | 52.28% | |
| Democratic | James Francis Thaddeus O'Connor | 92,464 | 47.72% | |
| Majority | 8,848 | 4.56% | ||
| Turnout | 193,776 | |||
| Republican hold | ||||
Ohio
| |||||||||||||||||
| |||||||||||||||||
 County Results Fess: 40–50% 50–60% 60–70% 70–80% Pomerene: 50–60% 60–70% | |||||||||||||||||
| |||||||||||||||||


| Party | Candidate | Votes | % | |
|---|---|---|---|---|
| Republican | Simeon D. Fess | 794,159 | 50.90% | |
| Democratic | Atlee Pomerene (Incumbent) | 744,558 | 47.72% | |
| Independent | Virginia D. Green | 21,514 | 1.38% | |
| Majority | 49,601 | 3.18% | ||
| Turnout | 1,560,231 | |||
| Republican gain from Democratic | ||||
Pennsylvania
There were 3 elections in Pennsylvania.
Pennsylvania (special, class 1)
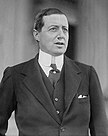
One-term Republican Philander C. Knox died October 12, 1921, and Republican state senator William E. Crow was appointed October 24, 1921 to continue the term, pending a special election. Crow then died August 2, 1922, and Republican attorney David A. Reed was appointed, also to continue the term, pending a special election. Reed won that election as well as the election to the next term.
| |||||||||||||||||||||
| |||||||||||||||||||||
| |||||||||||||||||||||
| Party | Candidate | Votes | % | |
|---|---|---|---|---|
| Republican | David A. Reed (Incumbent) | 860,483 | 86.15% | |
| Prohibition | Rachel C. Robinson | 60,390 | 6.05% | |
| Socialist | William J. Van Essen | 55,703 | 5.58% | |
| Single Tax | Thomas J. Davis | 21,997 | 2.20% | |
| None | Scattering | 287 | 0.03% | |
| Majority | 800,093 | 80.10% | ||
| Turnout | 998,860 | |||
| Republican hold | ||||
Pennsylvania (regular)
| |||||||||||||||||||||
| |||||||||||||||||||||
 County results Reed: 50-60% 60-70% 70–80% 80-90% Shull: 40–50% 50–60% 60–70% 70–80% | |||||||||||||||||||||
| |||||||||||||||||||||


| Party | Candidate | Votes | % | |
|---|---|---|---|---|
| Republican | David A. Reed (Incumbent) | 802,146 | 55.61% | |
| Democratic | Samuel L. Schull | 434,583 | 30.13% | |
| Progressive | William J. Burke | 127,180 | 8.82% | |
| Prohibition | Rachel C. Robinson | 41,935 | 2.91% | |
| Socialist | Charles Sehl | 33,004 | 2.29% | |
| Single Tax | Charles J. Schoales | 3,596 | 0.25% | |
| None | Scattering | 41 | 0.00% | |
| Majority | 367563 | 25.48% | ||
| Turnout | 1442485 | |||
| Republican hold | ||||
Reed would serve until 1935.
Pennsylvania (special, class 3)
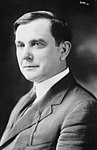
Five-term Republican Boies Penrose died December 31, 1921, and Republican attorney George W. Pepper was appointed January 9, 1922 to continue the term, pending a special election, which he then won.
| |||||||||||||||||
| |||||||||||||||||
 County results Pepper: 30-40% 40-50% 50-60% 60-70% 70–80% Kerr: 40–50% 50–60% 60–70% | |||||||||||||||||
| |||||||||||||||||

| Party | Candidate | Votes | % | |
|---|---|---|---|---|
| Republican | George W. Pepper (Incumbent) | 819,507 | 57.60% | |
| Democratic | Fred B. Kerr | 468,330 | 32.91% | |
| Progressive | Earl W. Thompson | 57,075 | 4.01% | |
| Socialist | William J. Van Essen | 38,440 | 2.70% | |
| Prohibition | Frank G. Lewis | 34,089 | 2.40% | |
| Single Tax | James A. Robinson | 5,356 | 0.38% | |
| Majority | 351,177 | 24.69% | ||
| Turnout | 1422856 | |||
| Republican hold | ||||
Pepper would only serve out that term, losing renomination in 1926.
Rhode Island
| |||||||||||||||||
| |||||||||||||||||
| |||||||||||||||||
| Party | Candidate | Votes | % | |
|---|---|---|---|---|
| Democratic | Peter G. Gerry (Incumbent) | 82,889 | 52.17% | |
| Republican | Robert Livingston Beeckman | 68,930 | 43.38% | |
| Socialist Labor | James Matthews | 6,102 | 3.84% | |
| Law and Order | James I. Bartholomew | 968 | 0.61% | |
| Majority | 13,959 | 8.79% | ||
| Turnout | 158,889 | |||
| Democratic hold | ||||
Tennessee
| |||||||||||||||||
| |||||||||||||||||
 McKellar: 50–60% 60–70% 70–80% 80–90% >90% Sanders: 50–60% 60–70% 70–80% | |||||||||||||||||
| |||||||||||||||||

| Party | Candidate | Votes | % | |
|---|---|---|---|---|
| Democratic | Kenneth D. McKellar (Incumbent) | 151,523 | 68.03% | |
| Republican | Newell Sanders | 71,200 | 31.97% | |
| Majority | 80,323 | 36.06% | ||
| Turnout | 222723 | |||
| Democratic hold | ||||
Texas
| ||||||||||||||||||||
| ||||||||||||||||||||
 County Results
Mayfield: 50–60% 60–70% 70–80% 80–90% >90% | ||||||||||||||||||||
| ||||||||||||||||||||


Incumbent Democratic U.S. Senator Charles Culberson ran for re-election to a fifth term, but he lost the Democratic primary. Railroads Commissioner Earle Bradford Mayfield defeated former Governor Pa Ferguson in the primary runoff. Mayfield won the runoff, but because of his support of the resurgent Ku Klux Klan, anti-Klan activists in the Democratic Party including George Peddy attempted to have him stripped of the nomination. After this failed, Peddy ran as the candidate of the "Independent Democrats." The Texas Republican Party also backed Peddy, but after a lengthy court battle, they were unable to have him included on the general election ballot as their official nominee. Peddy instead ran as a write-in candidate, but he lost the general election to Mayfield.
| Party | Candidate | Votes | % | |
|---|---|---|---|---|
| Democratic | Earle Bradford Mayfield | 264,260 | 66.90% | |
| Independent Democratic | George E. B. Peddy (write-in) | 130,744 | 33.10% | |
| Majority | 133,516 | 33.80% | ||
| Turnout | 395,004 | |||
| Democratic hold | ||||
Utah
| |||||||||||||||||
| |||||||||||||||||
| |||||||||||||||||
| Party | Candidate | Votes | % | |
|---|---|---|---|---|
| Democratic | William H. King (Incumbent) | 58,749 | 48.63% | |
| Republican | Ernest Bamberger | 58,188 | 48.16% | |
| Socialist | Charles T. Stoney | 3,875 | 3.21% | |
| Majority | 561 | 0.47% | ||
| Turnout | 120,812 | |||
| Democratic hold | ||||
Vermont
| |||||||||||||||||
| |||||||||||||||||
 County results Greene: 50–60% 60–70% 70–80% 80–90% Mayo: 50–60% | |||||||||||||||||
| |||||||||||||||||


| Party | Candidate | Votes | % | |
|---|---|---|---|---|
| Republican | Frank L. Greene | 47,669 | 69.04% | |
| Democratic | William B. Mayo | 21,375 | 30.96% | |
| Majority | 26,294 | 38.08% | ||
| Turnout | 69,044 | |||
| Republican hold | ||||
Virginia
| |||||||||||||||||
| |||||||||||||||||
| |||||||||||||||||

| Party | Candidate | Votes | % | |
|---|---|---|---|---|
| Democratic | Claude A. Swanson (inc.) | 116,393 | 71.88% | |
| Republican | J. .W McGavock | 42,903 | 26.50% | |
| Independent | Matt N. Lewis | 2,627 | 1.62% | |
| Majority | 73,490 | 45.38% | ||
| Turnout | 161,923 | |||
| Democratic hold | ||||
Washington
| |||||||||||||||||||||
| |||||||||||||||||||||
 County results Dill: 40–50% 50–60% 60–70% Poindexter: 30–40% 40–50% 50–60% 60–70% | |||||||||||||||||||||
| |||||||||||||||||||||

| Party | Candidate | Votes | % | |
|---|---|---|---|---|
| Democratic | Clarence Dill | 130,347 | 44.27% | |
| Republican | Miles Poindexter (Incumbent) | 126,410 | 42.93% | |
| Farmer–Labor | James A. Duncan | 35,326 | 12.00% | |
| Socialist Labor | David Burgess | 1,904 | 0.65% | |
| Workers | Frans Bostrom | 482 | 0.16% | |
| Majority | 3,937 | 1.34% | ||
| Turnout | 294,469 | |||
| Democratic gain from Republican | ||||
West Virginia
| |||||||||||||||||
| |||||||||||||||||
 County results Neely: 40–50% 50–60% 60–70% 70–80% Sutherland: 40–50% 50–60% 60–70% 70–80% | |||||||||||||||||
| |||||||||||||||||
| Party | Candidate | Votes | % | |
|---|---|---|---|---|
| Democratic | Matthew M. Neely | 198,853 | 51.15% | |
| Republican | Howard Sutherland (Incumbent) | 185,046 | 47.59% | |
| Socialist | M. S. Holt | 4,895 | 1.26% | |
| Majority | 13,807 | 3.56% | ||
| Turnout | 388,794 | |||
| Democratic gain from Republican | ||||
Wisconsin
| |||||||||||||||||
| |||||||||||||||||
 County results La Follette: 50–60% 60–70% 70–80% 80–90% >90% | |||||||||||||||||
| |||||||||||||||||

| Party | Candidate | Votes | % | |
|---|---|---|---|---|
| Republican | Robert M. La Follette (Incumbent) | 379,494 | 80.67% | |
| Independent | Jessie Jack Hooper | 78,029 | 16.59% | |
| Prohibition | Adolph R. Buckman | 11,254 | 2.39% | |
| Independent | Richard Koeppel | 1,656 | 0.35% | |
| Majority | 301,465 | 64.08% | ||
| Turnout | 470,433 | |||
| Republican hold | ||||
Wyoming
| |||||||||||||||||
| |||||||||||||||||
 County results Kendrick: 50–60% 60–70% Mondell: 50–60% No Data/Vote: | |||||||||||||||||
| Party | Candidate | Votes | % | |
|---|---|---|---|---|
| Democratic | John B. Kendrick (Incumbent) | 35,734 | 56.74% | |
| Republican | Frank Wheeler Mondell | 26,627 | 42.28% | |
| Socialist | W. B. Guthrie | 612 | 0.97% | |
| Majority | 9,107 | 14.46% | ||
| Turnout | 62,973 | |||
| Democratic hold | ||||
See also
- 1923 United States Senate elections
- 1922 United States elections
- 67th United States Congress
- 68th United States Congress
Notes
- ^ as Republican Conference Chairman and unofficial majority leader
- Appointee defeated
- ^ Appointee elected
References
- "Our Campaigns - ND US Senate Race - Nov 07, 1922". www.ourcampaigns.com. Retrieved December 21, 2017.
- ^ "Statistics of the Congressional Election of November 7, 1922" (PDF). Clerk.house.gov. Retrieved August 21, 2019.
- "Sample Ballot, General Election". The Frontier. November 2, 1922. p. 7.
- Heard, Alexander; Strong, Donald (1950). Southern Primaries and Elections 1920-1949. University of Alabama Press. pp. 167–169. ISBN 9780836955248.
- "CULBERSON ADMITS DEFEAT; Texan Senator Tells Friends to Support Whom They Please". The New York Times. July 27, 1922. p. 4. ISSN 0362-4331. Retrieved April 28, 2023.
- Fleming, Richard T. "Biography, George Edwin Bailey Peddy (1892–1951)". Handbook of Texas. Austin, TX: Texas State Historical Association. Retrieved January 9, 2021.
- "PARIES JOIN IN TO OPPOSE: George E. B. Peddy Senatorial Nominee by licans and Independent Democrats". St. Louis Post - Dispatch. September 17, 1922. p. 4. Retrieved April 28, 2023.
- "KEEP PEDDY'S NAME OFF TEXAS BALLOT; Federal Judges Decline to Order Fusion Senatorial Nominee Placed on Ticket". The New York Times. October 24, 1922. p. 17. ISSN 0362-4331. Retrieved April 28, 2023.
- "LANDSLIDE FOR MAYFIELD: PEDDY FACTION LOSES BY OVER 150,000 VOTES". The Austin Statesman. November 8, 1922. p. 1. Retrieved April 28, 2023.