| ||||||||||||||||||||||||||
| ||||||||||||||||||||||||||
| ||||||||||||||||||||||||||
| ||||||||||||||||||||||||||

The 1928 United States presidential election in Connecticut took place on November 6, 1928, as part of the 1928 United States presidential election which was held throughout all contemporary 48 states. Voters chose seven representatives, or electors to the Electoral College, who voted for president and vice president.
During the Third Party System, Connecticut was one of a small number of critical swing states due to its opposing Democratic Catholic and Republican Yankee populations being closely matched at the polls. However, the fear William Jennings Bryan generated amongst the northeastern industrial elite, and among Catholic voters who belonged to a church that condemned free silver, meant that after the “Panic of 1893” Connecticut became substantially a one-party Republican state, although not to the same degree as many states in upper New England, the Midwest or the Pacific. No Democrat would serve as a United States Senator from the state during the “System of 1896”, and only one Democrat would serve as Governor — the aging Simeon E. Baldwin.
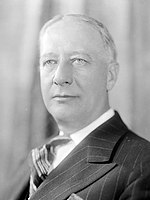
In 1920 and 1924 Democratic nominees James M. Cox and John W. Davis had carried only one and three towns respectively in Connecticut, with Southern Democrat Davis winning only 27.53 percent of the state's vote. However, in 1928, the Democratic Party nominated Alfred E. Smith, a New York City-born Roman Catholic of Irish, Italian, and German immigrant heritage, who appealed greatly to the urban ethnic and Catholic immigrant populations that populated northeastern states like Connecticut. Smith was the first Catholic ever to be nominated for president on a major party presidential ticket, and while his Catholicism greatly weakened his candidacy in many rural parts of the United States, especially in the traditionally Democratic “Solid South” and the pro-La Follette Pacific Northwest, Catholics across the United States identified with him greatly.
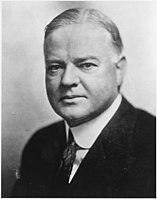
In straw poll from late September, Republican nominees, former Secretary of Commerce Herbert Hoover of California and Senate Majority Leader Charles Curtis of Kansas, was narrowly leading Smith and Senator Joseph Taylor Robinson of Arkansas. However, another straw poll from early October saw Hoover leading Smith in Connecticut by more than two-to-one, and a similar results was obtained with a larger poll mid-month. The Boston Globe in the second week also saw Hoover carrying the state, as did a later poll that nonetheless thought Smith was helped in Connecticut by his opposition to Prohibition.
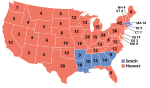
Hoover ultimately won Connecticut by 8.06 percentage points; however, this was a major Democratic advance on the 1920 and 1924 party results when the Republicans won by 34.01 and 29.69 points respectively with Smith carrying seventeen towns that voted for Calvin Coolidge in 1924. Most critically, Smith carried the four most populous towns of Hartford, New London, Bridgeport and Waterbury. He also became the first Democrat ever to carry the towns of Enfield and Putnam and the first since 1852 to carry Plainfield and Thompson, all of which were home to large Catholic populations. Whereas in 1924 Connecticut had been Coolidge's seventh-best state, in 1928 it was Catholic Smith's fourteenth-best state of forty-eight, and voted 9.36 points more Democratic than the nation at-large, this being the first time since 1892 Connecticut had been more Democratic than the nation.
Results
| 1928 United States presidential election in Connecticut | ||||||||
|---|---|---|---|---|---|---|---|---|
| Party | Candidate | Running mate | Popular vote | Electoral vote | ||||
| Count | % | Count | % | |||||
| Republican | Herbert Hoover of California | Charles Curtis of Kansas | 296,641 | 53.63% | 7 | 100.00% | ||
| Democratic | Al Smith of New York | Joseph Taylor Robinson of Arkansas | 252,085 | 45.57% | 0 | 0.00% | ||
| Socialist | Norman Thomas of New York | James Hudson Maurer of Pennsylvania | 3,029 | 0.55% | 0 | 0.00% | ||
| Communist | William Z. Foster of Massachusetts | Benjamin Gitlow of New York | 738 | 0.13% | 0 | 0.00% | ||
| Socialist Labor | Verne L. Reynolds of Michigan | Jeremiah D. Crowley of New York | 625 | 0.10% | 0 | 0.00% | ||
| N/A | Others | Others | 6 | 0.01% | 0 | 0.00% | ||
| Total | 553,124 | 100.00% | 7 | 100.00% | ||||
By county
| 1928 United States presidential election in Connecticut (by county) | |||||||
|---|---|---|---|---|---|---|---|
| County | Hoover % | Hoover # | Smith % | Smith # | Others % | Others # | Total # |
| Fairfield | 55.8% | 71,388 | 43.4% | 55,488 | 0.8% | 1,043 | 127,919 |
| Hartford | 53.2% | 75,997 | 46.0% | 65,789 | 0.8% | 1,167 | 142,953 |
| Litchfield | 63.7% | 19,154 | 35.8% | 10,761 | 0.5% | 138 | 30,053 |
| Middlesex | 59.9% | 11,204 | 39.5% | 7,380 | 0.6% | 112 | 18,696 |
| New Haven | 49.1% | 80,952 | 50.1% | 82,623 | 0.9% | 1,435 | 165,010 |
| New London | 56.3% | 21,378 | 42.9% | 16,297 | 0.8% | 288 | 37,963 |
| Tolland | 59.8% | 6,502 | 39.1% | 4,255 | 1.1% | 125 | 10,882 |
| Windham | 51.4% | 10,039 | 48.3% | 9,447 | 0.3% | 63 | 19,549 |
By town
| 1928 United States presidential election in Connecticut (by town) | |||||||||||||
|---|---|---|---|---|---|---|---|---|---|---|---|---|---|
| Town | Herbert Clark Hoover Republican |
Alfred Emmanuel Smith Democratic |
Norman Mattoon Thomas Socialist |
William Zebulon Foster Communist |
Verne L. Reynolds Socialist Labor |
Margin | Total votes cast | ||||||
| # | % | # | % | # | % | # | % | # | % | # | % | ||
| Andover | 126 | 61.46% | 78 | 38.05% | 1 | 0.49% | 0 | 0.00% | 0 | 0.00% | 48 | 23.41% | 205 |
| Ansonia | 3,209 | 49.05% | 3,269 | 49.97% | 51 | 0.78% | 5 | 0.08% | 8 | 0.12% | -60 | -0.92% | 6,542 |
| Ashford | 145 | 54.31% | 120 | 44.94% | 2 | 0.75% | 0 | 0.00% | 0 | 0.00% | 25 | 9.36% | 267 |
| Avon | 369 | 67.34% | 172 | 31.39% | 5 | 0.91% | 1 | 0.18% | 1 | 0.18% | 197 | 35.95% | 548 |
| Barkhamsted | 241 | 78.25% | 66 | 21.43% | 1 | 0.32% | 0 | 0.00% | 0 | 0.00% | 175 | 56.82% | 308 |
| Beacon Falls | 310 | 57.94% | 217 | 40.56% | 1 | 0.19% | 7 | 1.31% | 0 | 0.00% | 93 | 17.38% | 535 |
| Berlin | 1,032 | 66.11% | 521 | 33.38% | 2 | 0.13% | 4 | 0.26% | 2 | 0.13% | 511 | 32.74% | 1,561 |
| Bethany | 119 | 74.38% | 40 | 25.00% | 1 | 0.63% | 0 | 0.00% | 0 | 0.00% | 79 | 49.38% | 160 |
| Bethel | 1,313 | 68.92% | 588 | 30.87% | 4 | 0.21% | 0 | 0.00% | 0 | 0.00% | 725 | 38.06% | 1,905 |
| Bethlehem | 187 | 80.26% | 46 | 19.74% | 0 | 0.00% | 0 | 0.00% | 0 | 0.00% | 141 | 60.52% | 233 |
| Bloomfield | 683 | 60.98% | 404 | 36.07% | 18 | 1.61% | 8 | 0.71% | 7 | 0.63% | 279 | 24.91% | 1,120 |
| Bolton | 121 | 62.37% | 73 | 37.63% | 0 | 0.00% | 0 | 0.00% | 0 | 0.00% | 48 | 24.74% | 194 |
| Bozrah | 169 | 47.21% | 186 | 51.96% | 1 | 0.28% | 1 | 0.28% | 1 | 0.28% | -17 | -4.75% | 358 |
| Branford | 1,826 | 64.32% | 1,001 | 35.26% | 6 | 0.21% | 5 | 0.18% | 1 | 0.04% | 825 | 29.06% | 2,839 |
| Bridgeport | 21,019 | 45.69% | 24,448 | 53.14% | 372 | 0.81% | 85 | 0.18% | 82 | 0.18% | -3,429 | -7.45% | 46,006 |
| Bridgewater | 163 | 74.09% | 56 | 25.45% | 1 | 0.45% | 0 | 0.00% | 0 | 0.00% | 107 | 48.64% | 220 |
| Bristol | 5,028 | 59.10% | 3,404 | 40.01% | 55 | 0.65% | 16 | 0.19% | 4 | 0.05% | 1,624 | 19.09% | 8,507 |
| Brookfield | 313 | 75.06% | 104 | 24.94% | 0 | 0.00% | 0 | 0.00% | 0 | 0.00% | 209 | 50.12% | 417 |
| Brooklyn | 346 | 49.50% | 352 | 50.36% | 1 | 0.14% | 0 | 0.00% | 0 | 0.00% | -6 | -0.86% | 699 |
| Burlington | 205 | 65.50% | 104 | 33.23% | 2 | 0.64% | 2 | 0.64% | 0 | 0.00% | 101 | 32.27% | 313 |
| Canaan | 190 | 74.51% | 65 | 25.49% | 0 | 0.00% | 0 | 0.00% | 0 | 0.00% | 125 | 49.02% | 255 |
| Canterbury | 208 | 68.20% | 92 | 30.16% | 4 | 1.31% | 1 | 0.33% | 0 | 0.00% | 116 | 38.03% | 305 |
| Canton | 689 | 69.95% | 291 | 29.54% | 5 | 0.51% | 0 | 0.00% | 0 | 0.00% | 398 | 40.41% | 985 |
| Chaplin | 119 | 75.32% | 36 | 22.78% | 2 | 1.27% | 1 | 0.63% | 0 | 0.00% | 83 | 52.53% | 158 |
| Cheshire | 941 | 75.22% | 310 | 24.78% | 0 | 0.00% | 0 | 0.00% | 0 | 0.00% | 631 | 50.44% | 1,251 |
| Chester | 387 | 64.50% | 211 | 35.17% | 2 | 0.33% | 0 | 0.00% | 0 | 0.00% | 176 | 29.33% | 600 |
| Clinton | 521 | 74.64% | 173 | 24.79% | 4 | 0.57% | 0 | 0.00% | 0 | 0.00% | 348 | 49.86% | 698 |
| Colchester | 373 | 54.93% | 299 | 44.04% | 6 | 0.88% | 1 | 0.15% | 0 | 0.00% | 74 | 10.90% | 679 |
| Colebrook | 181 | 73.58% | 65 | 26.42% | 0 | 0.00% | 0 | 0.00% | 0 | 0.00% | 116 | 47.15% | 246 |
| Columbia | 149 | 62.61% | 87 | 36.55% | 2 | 0.84% | 0 | 0.00% | 0 | 0.00% | 62 | 26.05% | 238 |
| Cornwall | 298 | 76.02% | 91 | 23.21% | 3 | 0.77% | 0 | 0.00% | 0 | 0.00% | 207 | 52.81% | 392 |
| Coventry | 465 | 63.87% | 262 | 35.99% | 1 | 0.14% | 0 | 0.00% | 0 | 0.00% | 203 | 27.88% | 728 |
| Cromwell | 659 | 69.22% | 287 | 30.15% | 1 | 0.11% | 3 | 0.32% | 2 | 0.21% | 372 | 39.08% | 952 |
| Danbury | 5,974 | 54.76% | 4,895 | 44.87% | 23 | 0.21% | 13 | 0.12% | 4 | 0.04% | 1,079 | 9.89% | 10,909 |
| Darien | 1,681 | 73.44% | 598 | 26.12% | 7 | 0.31% | 0 | 0.00% | 3 | 0.13% | 1,083 | 47.31% | 2,289 |
| Derby | 1,151 | 33.12% | 2,294 | 66.01% | 27 | 0.78% | 2 | 0.06% | 1 | 0.03% | -1,143 | -32.89% | 3,475 |
| Durham | 360 | 79.65% | 92 | 20.35% | 0 | 0.00% | 0 | 0.00% | 0 | 0.00% | 268 | 59.29% | 452 |
| East Granby | 202 | 66.89% | 97 | 32.12% | 0 | 0.00% | 2 | 0.66% | 1 | 0.33% | 105 | 34.77% | 302 |
| East Haddam | 476 | 65.03% | 253 | 34.56% | 3 | 0.41% | 0 | 0.00% | 0 | 0.00% | 223 | 30.46% | 732 |
| East Hampton | 713 | 55.57% | 566 | 44.12% | 2 | 0.16% | 2 | 0.16% | 0 | 0.00% | 147 | 11.46% | 1,283 |
| East Hartford | 3,506 | 56.02% | 2,725 | 43.54% | 13 | 0.21% | 6 | 0.10% | 8 | 0.13% | 781 | 12.48% | 6,258 |
| East Haven | 1,506 | 63.95% | 829 | 35.20% | 13 | 0.55% | 4 | 0.17% | 3 | 0.13% | 677 | 28.75% | 2,355 |
| East Lyme | 617 | 73.10% | 219 | 25.95% | 7 | 0.83% | 1 | 0.12% | 0 | 0.00% | 398 | 47.16% | 844 |
| East Windsor | 757 | 61.85% | 452 | 36.93% | 13 | 1.06% | 2 | 0.16% | 0 | 0.00% | 305 | 24.92% | 1,224 |
| Eastford | 171 | 83.01% | 35 | 16.99% | 0 | 0.00% | 0 | 0.00% | 0 | 0.00% | 136 | 66.02% | 206 |
| Easton | 282 | 75.00% | 88 | 23.40% | 5 | 1.33% | 1 | 0.27% | 0 | 0.00% | 194 | 51.60% | 376 |
| Ellington | 473 | 60.72% | 298 | 38.25% | 4 | 0.51% | 0 | 0.00% | 4 | 0.51% | 175 | 22.46% | 779 |
| Enfield | 1,861 | 44.01% | 2,362 | 55.85% | 4 | 0.09% | 2 | 0.05% | 0 | 0.00% | -501 | -11.85% | 4,229 |
| Essex | 918 | 73.91% | 318 | 25.60% | 4 | 0.32% | 2 | 0.16% | 0 | 0.00% | 600 | 48.31% | 1,242 |
| Fairfield | 3,041 | 63.66% | 1,698 | 35.55% | 30 | 0.63% | 4 | 0.08% | 4 | 0.08% | 1,343 | 28.11% | 4,777 |
| Farmington | 1,008 | 54.02% | 849 | 45.50% | 9 | 0.48% | 0 | 0.00% | 0 | 0.00% | 159 | 8.52% | 1,866 |
| Franklin | 142 | 72.82% | 53 | 27.18% | 0 | 0.00% | 0 | 0.00% | 0 | 0.00% | 89 | 45.64% | 195 |
| Glastonbury | 1,258 | 59.34% | 852 | 40.19% | 8 | 0.38% | 2 | 0.09% | 0 | 0.00% | 406 | 19.15% | 2,120 |
| Goshen | 185 | 82.96% | 37 | 16.59% | 1 | 0.45% | 0 | 0.00% | 0 | 0.00% | 148 | 66.37% | 223 |
| Granby | 462 | 85.40% | 78 | 14.42% | 1 | 0.18% | 0 | 0.00% | 0 | 0.00% | 384 | 70.98% | 541 |
| Greenwich | 6,413 | 65.29% | 3,363 | 34.24% | 38 | 0.39% | 5 | 0.05% | 3 | 0.03% | 3,050 | 31.05% | 9,822 |
| Griswold | 603 | 43.54% | 778 | 56.17% | 4 | 0.29% | 0 | 0.00% | 0 | 0.00% | -175 | -12.64% | 1,385 |
| Groton | 2,427 | 77.15% | 704 | 22.38% | 12 | 0.38% | 3 | 0.10% | 0 | 0.00% | 1,723 | 54.77% | 3,146 |
| Guilford | 886 | 68.63% | 401 | 31.06% | 2 | 0.15% | 2 | 0.15% | 0 | 0.00% | 485 | 37.57% | 1,291 |
| Haddam | 546 | 75.31% | 176 | 24.28% | 3 | 0.41% | 0 | 0.00% | 0 | 0.00% | 370 | 51.03% | 725 |
| Hamden | 4,122 | 64.90% | 2,163 | 34.06% | 55 | 0.87% | 3 | 0.05% | 8 | 0.13% | 1,959 | 30.85% | 6,351 |
| Hampton | 177 | 79.37% | 44 | 19.73% | 0 | 0.00% | 0 | 0.00% | 2 | 0.90% | 133 | 59.64% | 223 |
| Hartford | 25,351 | 43.75% | 32,102 | 55.40% | 280 | 0.48% | 117 | 0.20% | 101 | 0.17% | -6,751 | -11.65% | 57,951 |
| Hartland | 108 | 81.82% | 23 | 17.42% | 0 | 0.00% | 1 | 0.76% | 0 | 0.00% | 85 | 64.39% | 132 |
| Harwinton | 220 | 76.39% | 67 | 23.26% | 1 | 0.35% | 0 | 0.00% | 0 | 0.00% | 153 | 53.13% | 288 |
| Hebron | 193 | 64.12% | 108 | 35.88% | 0 | 0.00% | 0 | 0.00% | 0 | 0.00% | 85 | 28.24% | 301 |
| Kent | 312 | 68.12% | 146 | 31.88% | 0 | 0.00% | 0 | 0.00% | 0 | 0.00% | 166 | 36.24% | 458 |
| Killingly | 1,557 | 53.75% | 1,334 | 46.05% | 5 | 0.17% | 0 | 0.00% | 1 | 0.03% | 223 | 7.70% | 2,897 |
| Killingworth | 99 | 64.71% | 53 | 34.64% | 1 | 0.65% | 0 | 0.00% | 0 | 0.00% | 46 | 30.07% | 153 |
| Lebanon | 344 | 81.90% | 75 | 17.86% | 1 | 0.24% | 0 | 0.00% | 0 | 0.00% | 269 | 64.05% | 420 |
| Ledyard | 261 | 83.92% | 49 | 15.76% | 1 | 0.32% | 0 | 0.00% | 0 | 0.00% | 212 | 68.17% | 311 |
| Lisbon | 219 | 67.18% | 105 | 32.21% | 2 | 0.61% | 0 | 0.00% | 0 | 0.00% | 114 | 34.97% | 326 |
| Litchfield | 979 | 65.18% | 514 | 34.22% | 6 | 0.40% | 1 | 0.07% | 2 | 0.13% | 465 | 30.96% | 1,502 |
| Lyme | 219 | 85.55% | 34 | 13.28% | 2 | 0.78% | 0 | 0.00% | 1 | 0.39% | 185 | 72.27% | 256 |
| Madison | 656 | 71.15% | 264 | 28.63% | 2 | 0.22% | 0 | 0.00% | 0 | 0.00% | 392 | 42.52% | 922 |
| Manchester | 5,205 | 67.30% | 2,473 | 31.98% | 48 | 0.62% | 6 | 0.08% | 2 | 0.03% | 2,732 | 35.32% | 7,734 |
| Mansfield | 696 | 76.23% | 209 | 22.89% | 8 | 0.88% | 0 | 0.00% | 0 | 0.00% | 487 | 53.34% | 913 |
| Marlborough | 70 | 47.62% | 71 | 48.30% | 3 | 2.04% | 1 | 0.68% | 2 | 1.36% | -1 | -0.68% | 147 |
| Meriden | 8,204 | 52.46% | 7,329 | 46.86% | 71 | 0.45% | 20 | 0.13% | 15 | 0.10% | 875 | 5.59% | 15,639 |
| Middlebury | 366 | 80.26% | 88 | 19.30% | 2 | 0.44% | 0 | 0.00% | 0 | 0.00% | 278 | 60.96% | 456 |
| Middlefield | 231 | 76.49% | 70 | 23.18% | 0 | 0.00% | 1 | 0.33% | 0 | 0.00% | 161 | 53.31% | 302 |
| Middletown | 3,980 | 51.18% | 3,738 | 48.06% | 37 | 0.48% | 8 | 0.10% | 14 | 0.18% | 242 | 3.11% | 7,777 |
| Milford | 3,536 | 67.82% | 1,618 | 31.03% | 48 | 0.92% | 6 | 0.12% | 6 | 0.12% | 1,918 | 36.79% | 5,214 |
| Monroe | 362 | 69.88% | 151 | 29.15% | 2 | 0.39% | 0 | 0.00% | 3 | 0.58% | 211 | 40.73% | 518 |
| Montville | 664 | 60.69% | 425 | 38.85% | 3 | 0.27% | 2 | 0.18% | 0 | 0.00% | 239 | 21.85% | 1,094 |
| Morris | 160 | 68.67% | 73 | 31.33% | 0 | 0.00% | 0 | 0.00% | 0 | 0.00% | 87 | 37.34% | 233 |
| Naugatuck | 2,459 | 46.59% | 2,773 | 52.54% | 24 | 0.45% | 9 | 0.17% | 13 | 0.25% | -314 | -5.95% | 5,278 |
| New Britain | 10,116 | 50.34% | 9,703 | 48.28% | 222 | 1.10% | 20 | 0.10% | 35 | 0.17% | 413 | 2.06% | 20,096 |
| New Canaan | 1,298 | 67.53% | 614 | 31.95% | 6 | 0.31% | 2 | 0.10% | 2 | 0.10% | 684 | 35.59% | 1,922 |
| New Fairfield | 155 | 76.35% | 48 | 23.65% | 0 | 0.00% | 0 | 0.00% | 0 | 0.00% | 107 | 52.71% | 203 |
| New Hartford | 435 | 58.78% | 304 | 41.08% | 1 | 0.14% | 0 | 0.00% | 0 | 0.00% | 131 | 17.70% | 740 |
| New Haven | 24,898 | 42.87% | 32,531 | 56.01% | 490 | 0.84% | 103 | 0.18% | 58 | 0.10% | -7,633 | -13.14% | 58,080 |
| New London | 4,668 | 51.61% | 4,309 | 47.64% | 53 | 0.59% | 8 | 0.09% | 6 | 0.07% | 359 | 3.97% | 9,044 |
| New Milford | 1,441 | 68.23% | 659 | 31.20% | 8 | 0.38% | 3 | 0.14% | 1 | 0.05% | 782 | 37.03% | 2,112 |
| Newington | 879 | 76.17% | 262 | 22.70% | 11 | 0.95% | 1 | 0.09% | 1 | 0.09% | 617 | 53.47% | 1,154 |
| Newtown | 663 | 52.45% | 599 | 47.39% | 1 | 0.08% | 1 | 0.08% | 0 | 0.00% | 64 | 5.06% | 1,264 |
| Norfolk | 461 | 57.55% | 340 | 42.45% | 0 | 0.00% | 0 | 0.00% | 0 | 0.00% | 121 | 15.11% | 801 |
| North Branford | 231 | 65.25% | 122 | 34.46% | 0 | 0.00% | 0 | 0.00% | 1 | 0.28% | 109 | 30.79% | 354 |
| North Canaan | 644 | 70.69% | 264 | 28.98% | 0 | 0.00% | 1 | 0.11% | 2 | 0.22% | 380 | 41.71% | 911 |
| North Haven | 960 | 77.80% | 265 | 21.47% | 8 | 0.65% | 1 | 0.08% | 0 | 0.00% | 695 | 56.32% | 1,234 |
| North Stonington | 320 | 79.40% | 79 | 19.60% | 3 | 0.74% | 1 | 0.25% | 0 | 0.00% | 241 | 59.80% | 403 |
| Norwalk | 7,865 | 61.32% | 4,867 | 37.95% | 38 | 0.30% | 15 | 0.12% | 41 | 0.32% | 2,998 | 23.37% | 12,826 |
| Norwich | 5,329 | 47.53% | 5,788 | 51.62% | 77 | 0.69% | 7 | 0.06% | 12 | 0.11% | -459 | -4.09% | 11,213 |
| Old Lyme | 398 | 72.63% | 147 | 26.82% | 2 | 0.36% | 0 | 0.00% | 1 | 0.18% | 251 | 45.80% | 548 |
| Old Saybrook | 459 | 65.20% | 244 | 34.66% | 1 | 0.14% | 0 | 0.00% | 0 | 0.00% | 215 | 30.54% | 704 |
| Orange | 469 | 84.20% | 88 | 15.80% | 0 | 0.00% | 0 | 0.00% | 0 | 0.00% | 381 | 68.40% | 557 |
| Oxford | 272 | 73.32% | 98 | 26.42% | 1 | 0.27% | 0 | 0.00% | 0 | 0.00% | 174 | 46.90% | 371 |
| Plainfield | 1,238 | 42.54% | 1,659 | 57.01% | 11 | 0.38% | 1 | 0.03% | 1 | 0.03% | -421 | -14.47% | 2,910 |
| Plainville | 1,418 | 70.51% | 581 | 28.89% | 7 | 0.35% | 2 | 0.10% | 3 | 0.15% | 837 | 41.62% | 2,011 |
| Plymouth | 981 | 59.64% | 654 | 39.76% | 7 | 0.43% | 3 | 0.18% | 0 | 0.00% | 327 | 19.88% | 1,645 |
| Pomfret | 427 | 62.43% | 256 | 37.43% | 0 | 0.00% | 0 | 0.00% | 1 | 0.15% | 171 | 25.00% | 684 |
| Portland | 950 | 55.33% | 755 | 43.97% | 11 | 0.64% | 1 | 0.06% | 0 | 0.00% | 195 | 11.36% | 1,717 |
| Preston | 357 | 78.63% | 95 | 20.93% | 1 | 0.22% | 1 | 0.22% | 0 | 0.00% | 262 | 57.71% | 454 |
| Prospect | 138 | 73.80% | 48 | 25.67% | 1 | 0.53% | 0 | 0.00% | 0 | 0.00% | 90 | 48.13% | 187 |
| Putnam | 1,289 | 46.07% | 1,501 | 53.65% | 8 | 0.29% | 0 | 0.00% | 0 | 0.00% | -212 | -7.58% | 2,798 |
| Redding | 488 | 69.12% | 218 | 30.88% | 0 | 0.00% | 0 | 0.00% | 0 | 0.00% | 270 | 38.24% | 706 |
| Ridgefield | 955 | 73.46% | 341 | 26.23% | 2 | 0.15% | 2 | 0.15% | 0 | 0.00% | 614 | 47.23% | 1,300 |
| Rocky Hill | 486 | 68.74% | 216 | 30.55% | 5 | 0.71% | 0 | 0.00% | 0 | 0.00% | 270 | 38.19% | 707 |
| Roxbury | 180 | 64.29% | 98 | 35.00% | 1 | 0.36% | 1 | 0.36% | 0 | 0.00% | 82 | 29.29% | 280 |
| Salem | 87 | 71.90% | 34 | 28.10% | 0 | 0.00% | 0 | 0.00% | 0 | 0.00% | 53 | 43.80% | 121 |
| Salisbury | 841 | 70.85% | 339 | 28.56% | 5 | 0.42% | 0 | 0.00% | 2 | 0.17% | 502 | 42.29% | 1,187 |
| Saybrook | 584 | 63.27% | 335 | 36.29% | 3 | 0.33% | 0 | 0.00% | 1 | 0.11% | 249 | 26.98% | 923 |
| Scotland | 128 | 78.05% | 36 | 21.95% | 0 | 0.00% | 0 | 0.00% | 0 | 0.00% | 92 | 56.10% | 164 |
| Seymour | 1,433 | 70.07% | 606 | 29.63% | 3 | 0.15% | 2 | 0.10% | 1 | 0.05% | 827 | 40.44% | 2,045 |
| Sharon | 503 | 77.98% | 137 | 21.24% | 3 | 0.47% | 2 | 0.31% | 0 | 0.00% | 366 | 56.74% | 645 |
| Shelton | 1,959 | 57.47% | 1,406 | 41.24% | 30 | 0.88% | 6 | 0.18% | 8 | 0.23% | 553 | 16.22% | 3,409 |
| Sherman | 99 | 69.72% | 40 | 28.17% | 1 | 0.70% | 1 | 0.70% | 1 | 0.70% | 59 | 41.55% | 142 |
| Simsbury | 695 | 60.49% | 450 | 39.16% | 1 | 0.09% | 1 | 0.09% | 2 | 0.17% | 245 | 21.32% | 1,149 |
| Somers | 422 | 62.33% | 252 | 37.22% | 3 | 0.44% | 0 | 0.00% | 0 | 0.00% | 170 | 25.11% | 677 |
| South Windsor | 459 | 56.60% | 344 | 42.42% | 6 | 0.74% | 2 | 0.25% | 0 | 0.00% | 115 | 14.18% | 811 |
| Southbury | 358 | 73.66% | 127 | 26.13% | 0 | 0.00% | 1 | 0.21% | 0 | 0.00% | 231 | 47.53% | 486 |
| Southington | 1,611 | 53.90% | 1,369 | 45.80% | 6 | 0.20% | 2 | 0.07% | 1 | 0.03% | 242 | 8.10% | 2,989 |
| Sprague | 365 | 40.92% | 524 | 58.74% | 3 | 0.34% | 0 | 0.00% | 0 | 0.00% | -159 | -17.83% | 892 |
| Stafford | 1,134 | 51.20% | 1,060 | 47.86% | 13 | 0.59% | 2 | 0.09% | 6 | 0.27% | 74 | 3.34% | 2,215 |
| Stamford | 10,014 | 54.84% | 8,106 | 44.39% | 71 | 0.39% | 50 | 0.27% | 20 | 0.11% | 1,908 | 10.45% | 18,261 |
| Sterling | 330 | 61.80% | 202 | 37.83% | 2 | 0.37% | 0 | 0.00% | 0 | 0.00% | 128 | 23.97% | 534 |
| Stonington | 2,565 | 57.22% | 1,876 | 41.85% | 28 | 0.62% | 7 | 0.16% | 7 | 0.16% | 689 | 15.37% | 4,483 |
| Stratford | 4,089 | 67.13% | 1,965 | 32.26% | 23 | 0.38% | 9 | 0.15% | 5 | 0.08% | 2,124 | 34.87% | 6,091 |
| Suffield | 1,037 | 70.21% | 438 | 29.65% | 0 | 0.00% | 0 | 0.00% | 2 | 0.14% | 599 | 40.56% | 1,477 |
| Thomaston | 1,058 | 63.62% | 599 | 36.02% | 6 | 0.36% | 0 | 0.00% | 0 | 0.00% | 459 | 27.60% | 1,663 |
| Thompson | 716 | 48.44% | 757 | 51.22% | 3 | 0.20% | 1 | 0.07% | 1 | 0.07% | -41 | -2.77% | 1,478 |
| Tolland | 256 | 58.99% | 173 | 39.86% | 3 | 0.69% | 0 | 0.00% | 2 | 0.46% | 83 | 19.12% | 434 |
| Torrington | 4,433 | 54.13% | 3,702 | 45.21% | 24 | 0.29% | 23 | 0.28% | 7 | 0.09% | 731 | 8.93% | 8,189 |
| Trumbull | 883 | 73.95% | 305 | 25.54% | 4 | 0.34% | 1 | 0.08% | 1 | 0.08% | 578 | 48.41% | 1,194 |
| Union | 81 | 76.42% | 25 | 23.58% | 0 | 0.00% | 0 | 0.00% | 0 | 0.00% | 56 | 52.83% | 106 |
| Vernon | 2,053 | 55.92% | 1,544 | 42.06% | 49 | 1.33% | 11 | 0.30% | 14 | 0.38% | 509 | 13.87% | 3,671 |
| Voluntown | 98 | 45.37% | 115 | 53.24% | 1 | 0.46% | 2 | 0.93% | 0 | 0.00% | -17 | -7.87% | 216 |
| Wallingford | 2,663 | 52.05% | 2,417 | 47.24% | 28 | 0.55% | 4 | 0.08% | 4 | 0.08% | 246 | 4.81% | 5,116 |
| Warren | 86 | 66.15% | 42 | 32.31% | 2 | 1.54% | 0 | 0.00% | 0 | 0.00% | 44 | 33.85% | 130 |
| Washington | 640 | 72.15% | 245 | 27.62% | 2 | 0.23% | 0 | 0.00% | 0 | 0.00% | 395 | 44.53% | 887 |
| Waterbury | 13,846 | 41.43% | 19,363 | 57.93% | 163 | 0.49% | 30 | 0.09% | 20 | 0.06% | -5,517 | -16.51% | 33,422 |
| Waterford | 1,153 | 72.93% | 405 | 25.62% | 20 | 1.27% | 2 | 0.13% | 1 | 0.06% | 748 | 47.31% | 1,581 |
| Watertown | 1,620 | 72.42% | 610 | 27.27% | 4 | 0.18% | 3 | 0.13% | 0 | 0.00% | 1,010 | 45.15% | 2,237 |
| West Hartford | 7,090 | 71.98% | 2,721 | 27.62% | 30 | 0.30% | 6 | 0.06% | 3 | 0.03% | 4,369 | 44.36% | 9,850 |
| West Haven | 5,703 | 57.09% | 4,201 | 42.05% | 55 | 0.55% | 10 | 0.10% | 21 | 0.21% | 1,502 | 15.04% | 9,990 |
| Westbrook | 322 | 73.18% | 109 | 24.77% | 7 | 1.59% | 0 | 0.00% | 2 | 0.45% | 213 | 48.41% | 440 |
| Weston | 257 | 73.43% | 89 | 25.43% | 2 | 0.57% | 2 | 0.57% | 0 | 0.00% | 168 | 48.00% | 350 |
| Westport | 1,628 | 67.52% | 775 | 32.14% | 4 | 0.17% | 2 | 0.08% | 2 | 0.08% | 853 | 35.38% | 2,411 |
| Wethersfield | 2,144 | 76.43% | 649 | 23.14% | 11 | 0.39% | 1 | 0.04% | 0 | 0.00% | 1,495 | 53.30% | 2,805 |
| Willington | 333 | 78.72% | 87 | 20.57% | 1 | 0.24% | 1 | 0.24% | 1 | 0.24% | 246 | 58.16% | 423 |
| Wilton | 659 | 77.53% | 185 | 21.76% | 4 | 0.47% | 1 | 0.12% | 1 | 0.12% | 474 | 55.76% | 850 |
| Winchester | 2,128 | 59.54% | 1,439 | 40.26% | 3 | 0.08% | 1 | 0.03% | 3 | 0.08% | 689 | 19.28% | 3,574 |
| Windham | 2,571 | 46.68% | 2,921 | 53.03% | 15 | 0.27% | 0 | 0.00% | 1 | 0.02% | -350 | -6.35% | 5,508 |
| Windsor | 1,873 | 65.31% | 978 | 34.10% | 12 | 0.42% | 5 | 0.17% | 0 | 0.00% | 895 | 31.21% | 2,868 |
| Windsor Locks | 395 | 26.33% | 1,098 | 73.20% | 4 | 0.27% | 1 | 0.07% | 2 | 0.13% | -703 | -46.87% | 1,500 |
| Wolcott | 259 | 75.95% | 78 | 22.87% | 4 | 1.17% | 0 | 0.00% | 0 | 0.00% | 181 | 53.08% | 341 |
| Woodbridge | 431 | 78.51% | 117 | 21.31% | 1 | 0.18% | 0 | 0.00% | 0 | 0.00% | 314 | 57.19% | 549 |
| Woodbury | 590 | 84.17% | 108 | 15.41% | 1 | 0.14% | 2 | 0.29% | 0 | 0.00% | 482 | 68.76% | 701 |
| Woodstock | 618 | 85.60% | 102 | 14.13% | 1 | 0.14% | 1 | 0.14% | 0 | 0.00% | 516 | 71.47% | 722 |
| Totals | 296,641 | 53.63% | 252,085 | 45.58% | 3,030 | 0.55% | 737 | 0.13% | 616 | 0.11% | 44,556 | 8.06% | 553,109 |
See also
Notes
- After La Follette, who in 1924 won one-sixth of the national vote and almost one-third in the one-party Republican Pacific States, died in June 1925, his family endorsed Smith.
- As of the 2020 presidential election, Hartford has never voted for a Republican presidential candidate since this election.
References
- Lua error in Module:Citation/CS1/Configuration at line 2083: attempt to index a boolean value.
- Lua error in Module:Citation/CS1/Configuration at line 2083: attempt to index a boolean value.
- Lua error in Module:Citation/CS1/Configuration at line 2083: attempt to index a boolean value.
- ^ Lua error in Module:Citation/CS1/Configuration at line 2083: attempt to index a boolean value.
- Lua error in Module:Citation/CS1/Configuration at line 2083: attempt to index a boolean value.
- Lua error in Module:Citation/CS1/Configuration at line 2083: attempt to index a boolean value.
- Phillips, Kevin P.; The Emerging Republican Majority, p. 502 ISBN 1400852293
- Lua error in Module:Citation/CS1/Configuration at line 2083: attempt to index a boolean value.
- Lua error in Module:Citation/CS1/Configuration at line 2083: attempt to index a boolean value.
- Lua error in Module:Citation/CS1/Configuration at line 2083: attempt to index a boolean value.
- Lua error in Module:Citation/CS1/Configuration at line 2083: attempt to index a boolean value.
- Lua error in Module:Citation/CS1/Configuration at line 2083: attempt to index a boolean value.
- Lua error in Module:Citation/CS1/Configuration at line 2083: attempt to index a boolean value.
- Lua error in Module:Citation/CS1/Configuration at line 2083: attempt to index a boolean value.
State and district results of the 1928 United States presidential election | ||
|---|---|---|
|  | |