| Demographics of Russia | |
|---|---|
 Population pyramid of Russia as of 1 January 2024 | |
| Population | |
| Growth rate | |
| Birth rate | |
| Death rate | |
| Life expectancy | |
| • male | |
| • female | |
| Fertility rate | |
| Infant mortality rate | |
| Net migration rate | |
| Age structure | |
| Under 18 years | ~23.21% |
| 18–44 years | ~34.73% |
| 45–64 years | 26.55% |
| 65 and over | 15.6% |
| Sex ratio | |
| Total | 0.86 male(s)/female (2009) |
| At birth | 1.06 male(s)/female |
| Under 15 | 1.06 male(s)/female (male 11,980,138/female 11,344,818) |
| 15–64 years | 0.925 male(s)/female (male 48,166,470/female 52,088,967) |
| 65 and over | 0.44 male(s)/female (male 5,783,983/female 13,105,896) |
| Nationality | |
| Nationality | noun: Russian(s) adjective: Russian |
| Major ethnic | Russians (71.73%) |
| Minor ethnic | |
| Language | |
| Official | Russian |
| Spoken | Languages of Russia |

| Year | Pop. | ±% p.a. |
|---|---|---|
| 0 | 9,000,000 | — |
| 1000 | 9,000,000 | +0.00% |
| 1200 | 14,500,000 | +0.24% |
| 1500 | 14,700,000 | +0.00% |
| 1600 | 18,000,000 | +0.20% |
| 1700 | 18,000,000 | +0.00% |
| 1800 | 25,000,000 | +0.33% |
| 1900 | 73,000,000 | +1.08% |
| 1926 | 93,000,000 | +0.94% |
| 1930 | 100,000,000 | +1.83% |
| 1960 | 119,000,000 | +0.58% |
| 1970 | 130,079,000 | +0.89% |
| 1979 | 137,552,000 | +0.62% |
| 1989 | 147,386,000 | +0.69% |
| 2000 | 146,597,000 | −0.05% |
| 2010 | 142,849,000 | −0.26% |
| 2021 | 144,700,000 | +0.12% |
| Source: | ||
As of the 2021 census, the population of Russia was 147.2 million. It is the most populous country in Europe, and the ninth-most populous country in the world, with a population density of 8.5 inhabitants per square kilometre (22 inhabitants/sq mi). As of 2020, the overall life expectancy in Russia at birth was 71.54 years (66.49 years for males and 76.43 years for females).
From 1992 to 2012, and again since 2016, Russia's death rate has exceeded its birth rate, which has been called a demographic crisis by analysts. Consequently, the nation has an ageing population, with the median age of the country being 40.3 years. In 2009, Russia recorded annual population growth for the first time in fifteen years; during the mid-2010s, Russia had seen increased population growth due to declining death rates, increased birth rates and increased immigration. Between 2020 and 2021, prior to the Russian invasion of Ukraine, Russia's population had undergone its largest peacetime decline in recorded history, due to excess deaths from the COVID-19 pandemic. In addition, at least 1 million Russians fled the country as a result of the invasion.
Russia is a multinational state, home to over 193 ethnic groups nationwide. In the 2021 Census, nearly 72% of the population were ethnic Russians and approximately 19% of the population were ethnic minorities. According to the United Nations, Russia's immigrant population is the world's third largest, numbering over 11.6 million; most of whom are from other post-Soviet states.
Population
Demographic statistics according to the latest Rosstat vital statistics and the World Population Review in 2019.
- One birth every 22 seconds
- One death every 13 seconds
- Net loss of one person every 30 seconds
Graphs are unavailable due to technical issues. There is more info on Phabricator and on MediaWiki.org. |
Graphs are unavailable due to technical issues. There is more info on Phabricator and on MediaWiki.org. |
Graphs are unavailable due to technical issues. There is more info on Phabricator and on MediaWiki.org. |
Demographic crisis


After having peaked at 148,689,000 in 1991, the population then decreased, falling to 142,737,196 by 2008. Russia has become increasingly reliant on immigration to maintain its population; 2021 had the highest net immigration since 1994, despite which there was a small overall decline from 146.1 million to 145.4 million in 2021, the largest decline in over a decade.
The natural population had declined by 997,000 between October 2020 and September 2021 (the difference between the number of births and the number of deaths over a period). The natural death rate in January 2020, 2021, and 2022 have each been nearly double the natural birth rate.
Following the Russian invasion of Ukraine in 2022, the demographic crisis in the country has deepened, as the country has allegedly suffered high military fatalities while facing renewed brain drain and human capital flight caused by Western mass-sanctions and boycotts. Many commentators predict that the situation will be worse than during the 1990s.
In March 2023 The Economist reported that "Over the past three years the country has lost around 2 million more people than it would ordinarily have done, as a result of war , disease and exodus."
The UN is projecting that the decline that started in 2021 will continue, and if current demographic conditions persist, Russia's population will be 120 million in 50 years, a decline of about 17%. In January 2024, the Russian statistics agency Rosstat predicted that Russia's population could drop to 130 million by 2046.
Fertility

Between 1993 and 2008 there was a great decrease in the country's population from 148 to 143 million. There was a huge 50% decrease in the number of births per year from 2.5 million in 1987 to 1.2 million since 1997, but the current 1.42 fertility rate is still higher than that of the 1990s.
At the beginning of 2022, 320,400 babies were born between January and March, 16,600 fewer than January–March 2021. There were nearly twice as many deaths (584,700) as births. The crude birth rate – 8.9 per 100,000 inhabitants – was the lowest since the year 2000.
Russia has a low fertility rate with 1.42 children per woman in 2022, below 2.1 children per woman, which must be the number reached to maintain its population. As a result of their low fertility for decades, the Russian population is one of the oldest in the world with an average of 40.3 years.
Historical fertility rates
The total fertility rate is the number of children born to each woman. It is based on fairly good data for the entire period. Sources: Our World In Data and Gapminder Foundation.

In many of the years from 1843 to 1917, Russia had the highest total fertility rate in the world. These elevated fertility rates did not lead to population growth due to high mortality rate, the casualties of the Russian Revolution, the two world wars and to a lesser extent the political killings.
| TFR | Years | |||||||||
|---|---|---|---|---|---|---|---|---|---|---|
| 1840 | 1841 | 1842 | 1843 | 1844 | 1845 | 1846 | 1847 | 1848 | 1849 | |
| 7 | 7 | 7 | 7.01 | 7.02 | 7.03 | 7.05 | 7.06 | 7.08 | 7.08 | |
| 1850 | 1851 | 1852 | 1853 | 1854 | 1855 | 1856 | 1857 | 1858 | 1859 | |
| 7.07 | 7.07 | 7.07 | 7.06 | 7.05 | 7.03 | 7.01 | 7 | 6.98 | 6.97 | |
| 1860 | 1861 | 1862 | 1863 | 1864 | 1865 | 1866 | 1867 | 1868 | 1869 | |
| 6.95 | 6.93 | 6.95 | 6.96 | 6.98 | 6.99 | 7.01 | 7.02 | 6.51 | 6.87 | |
| 1870 | 1871 | 1872 | 1873 | 1874 | 1875 | 1876 | 1877 | 1878 | 1879 | |
| 6.74 | 7.03 | 6.85 | 7.24 | 7.17 | 7.15 | 7.02 | 6.87 | 6.58 | 6.98 | |
| 1880 | 1881 | 1882 | 1883 | 1884 | 1885 | 1886 | 1887 | 1888 | 1889 | |
| 6.8 | 6.66 | 7.03 | 6.89 | 6.83 | 6.74 | 6.47 | 6.61 | 6.96 | 6.8 | |
| 1890 | 1891 | 1892 | 1893 | 1894 | 1895 | 1896 | 1897 | 1898 | 1899 | |
| 6.71 | 7.44 | 6.57 | 7.17 | 7.18 | 7.34 | 7.43 | 7.52 | 7.28 | 7.36 | |
| 1900 | 1901 | 1902 | 1903 | 1904 | 1905 | 1906 | 1907 | 1908 | 1909 | |
| 7.36 | 7.2 | 7.36 | 7.2 | 7.24 | 6.72 | 7.04 | 7.08 | 7.44 | 7.12 | |
| 1910 | 1911 | 1912 | 1913 | 1914 | 1915 | 1916 | 1917 | 1918 | 1919 | |
| 7.2 | 7.2 | 7.2 | 6.96 | 6.88 | 3.36 | 5.2 | 5.04 | 5.72 | 3.44 | |
| 1920 | 1921 | 1922 | 1923 | 1924 | 1925 | 1926 | ||||
| 6.72 | 4.72 | 6 | 6.48 | 6.72 | 6.8 | 6.72 | ||||
| Years | 1941 | 1942 | 1943 | 1944 | 1945 |
|---|---|---|---|---|---|
| 4.60 | 2.96 | 1.68 | 1.72 | 1.92 |

Historical crude birth rates

| Years | 1801–1810 | 1811–1820 | 1821–1830 | 1831–1840 | 1841–1850 | 1851–1860 |
|---|---|---|---|---|---|---|
| Crude birth rates of Russia | 43.7 | 40.0 | 42.7 | 45.6 | 49.7 | 52.4 |
| Years | 1861–1870 | 1871–1880 | 1881–1890 | 1891–1900 | 1901–1910 | 1911–1914 | 18th century (only Orthodox) |
1801–1860 (only Orthodox) |
|---|---|---|---|---|---|---|---|---|
| Crude birth rates of Russia | 50.3 | 50.4 | 50.4 | 49.2 | 46.8 | 43.9 | 51.0 | 50.0 |
Age structure
-
 Population pyramid in 1927
 -
 Population pyramid in 1941
 -
 Population pyramid in 1946
 -
 Population pyramid in 2015
 -
 Population pyramid in 2021
 -
 Russia animated population pyramid 1946-2023
| Age Group | Male | Female | Total | % |
|---|---|---|---|---|
| Total | 66,264,910 | 76,936,820 | 143,201,730 | 100 |
| 0–4 | 4,377,526 | 4,155,682 | 8,533,208 | 5.97 |
| 5–9 | 3,762,806 | 3,588,032 | 7,350,838 | 5.13 |
| 10–14 | 3,396,364 | 3,231,761 | 6,628,125 | 4.63 |
| 15–19 | 3,776,026 | 3,615,840 | 7,391,866 | 5.16 |
| 20–24 | 5,708,187 | 5,515,543 | 11,223,730 | 7.84 |
| 25–29 | 6,262,379 | 6,179,628 | 12,442,007 | 8.69 |
| 30–34 | 5,583,513 | 5,647,636 | 11,231,149 | 7.84 |
| 35–39 | 5,087,565 | 5,331,818 | 10,419,383 | 7.28 |
| 40–44 | 4,589,504 | 4,861,983 | 9,451,487 | 6.60 |
| 45–49 | 4,632,279 | 5,151,813 | 9,784,092 | 6.83 |
| 50–54 | 5,279,364 | 6,219,077 | 11,498,441 | 8.03 |
| 55–59 | 4,480,855 | 5,817,559 | 10,298,414 | 7.19 |
| 60–64 | 3,523,990 | 5,010,867 | 8,534,857 | 5.96 |
| 65–69 | 1,602,839 | 2,571,671 | 4,174,510 | 2.92 |
| 70–74 | 1,989,724 | 3,975,348 | 5,965,072 | 4.17 |
| 75–79 | 1,179,476 | 2,709,384 | 3,888,860 | 2.72 |
| 80–84 | 722 151 | 2,073,803 | 2,795,954 | 1.95 |
| 85–89 | 253 028 | 1,008,627 | 1,261,655 | 0.88 |
| 90–94 | 46 736 | 219 427 | 266 163 | 0.19 |
| 95–99 | 8 634 | 43 988 | 52 622 | 0.04 |
| 100+ | 1 964 | 7 333 | 9 297 | 0.01 |
| Age group | Male | Female | Total | Percent |
| 0–14 | 11,536,696 | 10,975,475 | 22,512,171 | 15.72 |
| 15–64 | 48,923,662 | 53,351,764 | 102,275,426 | 71.42 |
| 65+ | 5,804,552 | 12,609,581 | 18,414,133 | 12.86 |
Median age

- total: 40.7 years. Country comparison to the world: 51st
- male: 37.6 years
- female: 43.5 years (2021 est.)
Life expectancy

- total population: 70.06 years for a child born in 2021, decreasing from 73.34 in 2019
- male: 65.51 years (2021)
- female: 74.51 years (2021)
Infant mortality rate
- total: 4.5 deaths/1,000 live births (2020)
- male: 5.0 deaths/1,000 live births (2020)
- female: 3.9 deaths/1,000 live births (2020)
Vital statistics
Notable events in demography of Russia:
- 1930–33 South Soviet Famine
- 1940–1945 Second World War
- 1988–1991 Dissolution of the Soviet Union and 90s Shock therapy (economics)
Before WW2
| Average population | Live births | Deaths | Natural change | Crude birth rate (per 1,000) | Crude death rate (per 1,000) | Natural change (per 1,000) | Total Fertility Rates | Life expectancy | |||
|---|---|---|---|---|---|---|---|---|---|---|---|
| male | female | ||||||||||
| 1927 | 94,596,000 | 4,688,000 | 2,705,000 | 1,983,000 | 49.6 | 28.6 | 21.0 | 6.73 | 33.7 | 37.9 | |
| 1928 | 96,654,000 | 4,723,000 | 2,589,000 | 2,134,000 | 48.9 | 26.8 | 22.1 | 6.56 | 35.9 | 40.4 | |
| 1929 | 98,644,000 | 4,633,000 | 2,819,000 | 1,814,000 | 47.0 | 28.6 | 18.4 | 6.23 | 33.7 | 38.2 | |
| 1930 | 100,419,000 | 4,413,000 | 2,738,000 | 1,675,000 | 43.9 | 27.3 | 16.7 | 5.83 | 34.6 | 38.7 | |
| 1931 | 101,948,000 | 4,412,000 | 3,090,000 | 1,322,000 | 43.3 | 30.3 | 13.0 | 5.63 | 30.7 | 35.5 | |
| 1932 | 103,136,000 | 4,058,000 | 3,077,000 | 981,000 | 39.3 | 29.8 | 9.5 | 5.09 | 30.5 | 35.7 | |
| 1933 | 102,706,000 | 3,313,000 | 5,239,000 | −1,926,000 | 32.3 | 51.0 | −18.8 | 4.15 | 15.2 | 19.5 | |
| 1934 | 102,922,000 | 2,923,000 | 2,659,000 | 264,000 | 28.7 | 26.1 | 2.6 | 3.57 | 30.5 | 35.7 | |
| 1935 | 102,684,000 | 3,577,000 | 2,421,000 | 1,156,000 | 34.8 | 23.6 | 11.3 | 4.31 | 33.1 | 38.4 | |
| 1936 | 103,904,000 | 3,899,000 | 2,719,000 | 1,180,000 | 37.5 | 26.2 | 11.4 | 4.54 | 30.4 | 35.7 | |
| 1937 | 105,358,000 | 4,377,000 | 2,760,000 | 1,617,000 | 41.5 | 26.2 | 15.3 | 5.08 | 30.5 | 40.0 | |
| 1938 | 107,044,000 | 4,379,000 | 2,739,000 | 1,640,000 | 40.9 | 25.6 | 15.3 | 4.99 | 31.7 | 42.5 | |
| 1939 | 108,785,000 | 4,329,000 | 2,600,000 | 1,729,000 | 39.8 | 23.9 | 15.9 | 4.91 | 34.9 | 42.6 | |
| 1940 | 110,333,000 | 3,814,000 | 2,561,000 | 1,253,000 | 34.6 | 23.2 | 11.4 | 4.26 | 35.7 | 41.9 | |
After WW2
| Total average population (1 January 1993 onwards) | Live births | Deaths | Natural change | Crude birth rate (per 1,000) | Crude death rate (per 1,000) | Natural change (per 1,000) | Crude migration change (per 1,000) | Total Fertility Rates | Fertility | Life Expectancy | Abortions (including miscarriages) reported | ||||
|---|---|---|---|---|---|---|---|---|---|---|---|---|---|---|---|
| urban | rural | male | female | total | |||||||||||
| 1946 | 98,028,000 | 2,546,000 | 1,210,000 | 1,336,000 | 26.0 | 12.3 | 13.6 | -5.4 | 2.81 | 46.6 | 55.3 | ||||
| 1947 | 98,834,000 | 2,715,000 | 1,680,000 | 1,035,000 | 27.5 | 17.0 | 10.5 | -1.7 | 2.94 | 39.9 | 49.8 | ||||
| 1948 | 99,706,000 | 2,516,000 | 1,310,000 | 1,206,000 | 25.2 | 13.1 | 12.1 | 2.5 | 2.60 | 47.0 | 56.0 | ||||
| 1949 | 101,160,000 | 3,089,000 | 1,187,000 | 1,902,000 | 30.5 | 11.7 | 18.8 | -2.3 | 3.21 | 51.0 | 59.8 | ||||
| 1950 | 102,833,000 | 2,859,000 | 1,180,000 | 1,679,000 | 27.8 | 11.5 | 16.3 | -0.7 | 2.89 | 52.3 | 61.0 | ||||
| 1951 | 104,439,000 | 2,938,000 | 1,210,000 | 1,728,000 | 28.1 | 11.6 | 16.5 | 0 | 2.92 | 52.3 | 60.6 | ||||
| 1952 | 106,164,000 | 2,928,000 | 1,138,000 | 1,790,000 | 27.6 | 10.7 | 16.9 | -1.2 | 2.87 | 54.6 | 62.9 | ||||
| 1953 | 107,828,000 | 2,822,000 | 1,118,000 | 1,704,000 | 26.2 | 10.4 | 15.8 | 1.0 | 2.73 | 55.5 | 63.9 | ||||
| 1954 | 109,643,000 | 3,048,000 | 1,133,000 | 1,915,000 | 27.8 | 10.3 | 17.5 | 0.1 | 2.97 | 55.9 | 64.1 | ||||
| 1955 | 111,572,000 | 2,942,000 | 1,037,000 | 1,905,000 | 26.4 | 9.3 | 17.1 | -1.4 | 2.82 | 58.3 | 66.6 | ||||
| 1956 | 113,327,000 | 2,827,000 | 956,000 | 1,871,000 | 24.9 | 8.4 | 16.5 | -1.4 | 2.73 | 60.1 | 68.8 | ||||
| 1957 | 115,035,000 | 2,880,000 | 1,017,000 | 1,863,000 | 25.0 | 8.8 | 16.2 | -1.3 | 2.75 | 59.7 | 68.4 | 3,407,398 | |||
| 1958 | 116,749,000 | 2,861,000 | 931,000 | 1,930,000 | 24.5 | 8.0 | 16.5 | -3.2 | 2.69 | 61.8 | 70.4 | 3,939,362 | |||
| 1959 | 118,307,000 | 2,796,228 | 920,225 | 1,876,003 | 23.6 | 7.8 | 15.9 | -2.4 | 2.58 | 2.03 | 3.34 | 62.84 | 71.14 | 67.65 | 4,174,111 |
| 1960 | 119,906,000 | 2,782,353 | 886,090 | 1,896,263 | 23.2 | 7.4 | 15.8 | -1.8 | 2.56 | 2.06 | 3.26 | 63.67 | 72.31 | 68.67 | 4,373,042 |
| 1961 | 121,586,000 | 2,662,135 | 901,637 | 1,760,498 | 21.9 | 7.4 | 14.5 | -1.8 | 2.47 | 2.04 | 3.08 | 63.91 | 72.63 | 68.92 | 4,759,040 |
| 1962 | 123,128,000 | 2,482,539 | 949,648 | 1,532,891 | 20.2 | 7.7 | 12.4 | -1.1 | 2.36 | 1.98 | 2.92 | 63.67 | 72.27 | 68.58 | 4,925,124 |
| 1963 | 124,514,000 | 2,331,505 | 932,055 | 1,399,450 | 18.7 | 7.5 | 11.2 | -1.3 | 2.31 | 1.93 | 2.87 | 64.12 | 72.78 | 69.05 | 5,134,100 |
| 1964 | 125,744,000 | 2,121,994 | 901,751 | 1,220,243 | 16.9 | 7.2 | 9.7 | -1.7 | 2.19 | 1.88 | 2.66 | 64.89 | 73.58 | 69.85 | 5,376,200 |
| 1965 | 126,749,000 | 1,990,520 | 958,789 | 1,031,731 | 15.7 | 7.6 | 8.1 | -1.3 | 2.14 | 1.82 | 2.58 | 64.37 | 73.33 | 69.44 | 5,463,300 |
| 1966 | 127,608,000 | 1,957,763 | 974,299 | 983,464 | 15.3 | 7.6 | 7.7 | -1.8 | 2.13 | 1.85 | 2.58 | 64.29 | 73.55 | 69.51 | 5,322,500 |
| 1967 | 128,361,000 | 1,851,041 | 1,017,034 | 834,007 | 14.4 | 7.9 | 6.5 | -1.2 | 2.03 | 1.79 | 2.46 | 64.02 | 73.43 | 69.30 | 5,005,000 |
| 1968 | 129,037,000 | 1,816,509 | 1,040,096 | 776,413 | 14.1 | 8.1 | 6.0 | -1.2 | 1.98 | 1.75 | 2.44 | 63.73 | 73.56 | 69.26 | 4,872,900 |
| 1969 | 129,660,000 | 1,847,592 | 1,106,640 | 740,952 | 14.2 | 8.5 | 5.7 | -1.1 | 1.99 | 1.78 | 2.44 | 63.07 | 73.29 | 68.74 | 4,751,100 |
| 1970 | 130,252,000 | 1,903,713 | 1,131,183 | 772,530 | 14.6 | 8.7 | 5.9 | -0.7 | 2.00 | 1.77 | 2.52 | 63.07 | 73.44 | 68.86 | 4,837,700 |
| 1971 | 130,934,000 | 1,974,637 | 1,143,359 | 831,278 | 15.1 | 8.7 | 6.3 | -0.5 | 2.02 | 1.80 | 2.60 | 63.24 | 73.77 | 69.12 | 4,838,749 |
| 1972 | 131,687,000 | 2,014,638 | 1,181,802 | 832,836 | 15.3 | 9.0 | 6.3 | -0.6 | 2.03 | 1.81 | 2.59 | 63.24 | 73.62 | 69.02 | 4,765,900 |
| 1973 | 132,434,000 | 1,994,621 | 1,214,204 | 780,417 | 15.1 | 9.2 | 5.9 | 0 | 1.96 | 1.75 | 2.55 | 63.28 | 73.56 | 69.00 | 4,747,037 |
| 1974 | 133,217,000 | 2,079,812 | 1,222,495 | 857,317 | 15.6 | 9.2 | 6.4 | 0.2 | 2.00 | 1.78 | 2.63 | 63.12 | 73.77 | 68.99 | 4,674,050 |
| 1975 | 134,092,000 | 2,106,147 | 1,309,710 | 796,437 | 15.7 | 9.8 | 5.9 | 1.1 | 1.97 | 1.76 | 2.64 | 62.48 | 73.23 | 68.35 | 4,670,700 |
| 1976 | 135,026,000 | 2,146,711 | 1,352,950 | 793,761 | 15.9 | 10.0 | 5.9 | 1.2 | 1.96 | 1.74 | 2.62 | 62.19 | 73.04 | 68.10 | 4,757,055 |
| 1977 | 135,979,000 | 2,156,724 | 1,387,986 | 768,738 | 15.9 | 10.2 | 5.7 | 1.2 | 1.92 | 1.72 | 2.58 | 61.82 | 73.19 | 67.97 | 4,686,063 |
| 1978 | 136,922,000 | 2,179,030 | 1,417,377 | 761,653 | 15.9 | 10.4 | 5.6 | 0.5 | 1.90 | 1.70 | 2.55 | 61.83 | 73.23 | 68.01 | 4,656,057 |
| 1979 | 137,758,000 | 2,178,542 | 1,490,057 | 688,485 | 15.8 | 10.8 | 5.0 | 0.3 | 1.87 | 1.67 | 2.54 | 61.49 | 73.02 | 67.73 | 4,544,040 |
| 1980 | 138,483,000 | 2,202,779 | 1,525,755 | 677,024 | 15.9 | 11.0 | 4.9 | 0.4 | 1.87 | 1.68 | 2.51 | 61.38 | 72.96 | 67.70 | 4,506,249 |
| 1981 | 139,221,000 | 2,236,608 | 1,524,286 | 712,322 | 16.1 | 10.9 | 5.1 | 1.0 | 1.88 | 1.69 | 2.55 | 61.61 | 73.18 | 67.92 | 4,400,676 |
| 1982 | 140,067,420 | 2,328,044 | 1,504,200 | 823,844 | 16.6 | 10.7 | 5.9 | 1.2 | 1.96 | 1.76 | 2.63 | 62.24 | 73.64 | 68.38 | 4,462,825 |
| 1983 | 141,056,000 | 2,478,322 | 1,563,995 | 914,327 | 17.6 | 11.1 | 6.5 | 0.6 | 2.11 | 1.89 | 2.76 | 62.15 | 73.41 | 68.15 | 4,317,729 |
| 1984 | 142,061,000 | 2,409,614 | 1,650,866 | 758,748 | 17.0 | 11.6 | 5.3 | 1.5 | 2.06 | 1.86 | 2.69 | 61.71 | 72.96 | 67.67 | 4,361,959 |
| 1985 | 143,033,000 | 2,375,147 | 1,625,266 | 749,881 | 16.6 | 11.4 | 5.2 | 2.7 | 2.05 | 1.87 | 2.68 | 62.72 | 73.23 | 68.33 | 4,552,443 |
| 1986 | 144,156,000 | 2,485,915 | 1,497,975 | 987,940 | 17.2 | 10.4 | 6.9 | 1.0 | 2.18 | 1.98 | 2.83 | 64.77 | 74.22 | 69.95 | 4,579,400 |
| 1987 | 145,386,000 | 2,499,974 | 1,531,585 | 968,389 | 17.2 | 10.5 | 6.7 | 1.0 | 2.22 | 1.974 | 3.187 | 64.83 | 74.26 | 69.96 | 4,385,627 |
| 1988 | 146,505,000 | 2,348,494 | 1,569,112 | 779,382 | 16.0 | 10.7 | 5.3 | 0.4 | 2.13 | 1.90 | 3.06 | 64.61 | 74.25 | 69.81 | 4,608,953 |
| 1989 | 147,342,000 | 2,160,559 | 1,583,743 | 576,816 | 14.7 | 10.7 | 3.9 | 0.4 | 2.01 | 1.83 | 2.63 | 64.20 | 74.50 | 69.73 | 4,427,713 |
| 1990 | 147,969,000 | 1,988,858 | 1,655,993 | 332,865 | 13.4 | 11.2 | 2.2 | 0.7 | 1.892 | 1.698 | 2.600 | 63.76 | 74.32 | 69.36 | 4,103,425 |
| 1991 | 148,394,000 | 1,794,626 | 1,690,657 | 103,969 | 12.1 | 11.4 | 0.7 | 0.3 | 1.732 | 1.531 | 2.447 | 63.41 | 74.23 | 69.11 | 3,608,421 |
| 1992 | 148,538,000 | 1,587,644 | 1,807,441 | -219,797 | 10.7 | 12.2 | -1.5 | 1.7 | 1.547 | 1.351 | 2.219 | 61.96 | 73.71 | 67.98 | 3,436,695 |
| 1993 | 148,561,694 | 1,378,983 | 2,129,339 | -750,356 | 9.3 | 14.3 | -5.1 | 3.7 | 1.369 | 1.200 | 1.946 | 58.80 | 71.85 | 65.24 | 3,243,957 |
| 1994 | 148,355,867 | 1,408,159 | 2,301,366 | -893,207 | 9.5 | 15.5 | -6.0 | 6.7 | 1.394 | 1.238 | 1.917 | 57.38 | 71.07 | 63.93 | 3,060,237 |
| 1995 | 148,459,937 | 1,363,806 | 2,203,811 | -840,005 | 9.2 | 14.9 | -5.7 | 4.6 | 1.337 | 1.193 | 1.813 | 58.11 | 71.60 | 64.62 | 2,766,362 |
| 1996 | 148,291,638 | 1,304,638 | 2,082,249 | -777,611 | 8.8 | 14.1 | -5.2 | 3.4 | 1.270 | 1.140 | 1.705 | 59.61 | 72.41 | 65.89 | 2,652,038 |
| 1997 | 148,028,613 | 1,259,943 | 2,015,779 | -755,836 | 8.5 | 13.6 | -5.1 | 3.6 | 1.218 | 1.097 | 1.624 | 60.84 | 72.85 | 66.79 | 2,498,716 |
| 1998 | 147,802,133 | 1,283,292 | 1,988,744 | -705,452 | 8.7 | 13.5 | -4.8 | 3.0 | 1.232 | 1.109 | 1.643 | 61.19 | 73.12 | 67.14 | 2,346,138 |
| 1999 | 147,539,426 | 1,214,689 | 2,144,316 | -929,627 | 8.3 | 14.6 | -6.3 | 1.9 | 1.157 | 1.045 | 1.534 | 59.86 | 72.42 | 65.99 | 2,181,153 |
| 2000 | 146,890,128 | 1,266,800 | 2,225,332 | -958,532 | 8.6 | 15.2 | -6.5 | 2.5 | 1.195 | 1.089 | 1.554 | 58.99 | 72.25 | 65.38 | 2,138,800 |
| 2001 | 146,303,611 | 1,311,604 | 2,254,856 | -943,252 | 9.0 | 15.4 | -6.5 | 2.0 | 1.223 | 1.124 | 1.564 | 58.88 | 72.16 | 65.30 | 2,114,700 |
| 2002 | 145,649,334 | 1,396,967 | 2,332,272 | -935,305 | 9.6 | 16.1 | -6.4 | 1.7 | 1.286 | 1.189 | 1.633 | 58.68 | 71.90 | 64.95 | 1,944,481 |
| 2003 | 144,963,650 | 1,477,301 | 2,365,826 | -888,525 | 10.2 | 16.4 | -6.1 | 1.8 | 1.319 | 1.223 | 1.666 | 58.53 | 71.85 | 64.84 | 1,864,647 |
| 2004 | 144,333,586 | 1,502,477 | 2,295,402 | -792,925 | 10.4 | 15.9 | -5.5 | 1.8 | 1.344 | 1.253 | 1.654 | 58.91 | 72.36 | 65.31 | 1,797,567 |
| 2005 | 143,801,046 | 1,457,376 | 2,303,935 | -846,559 | 10.2 | 16.1 | -5.9 | 2.0 | 1.294 | 1.207 | 1.576 | 58.92 | 72.47 | 65.37 | 1,675,693 |
| 2006 | 143,236,582 | 1,479,637 | 2,166,703 | -687,066 | 10.3 | 15.1 | -4.8 | 2.2 | 1.305 | 1.210 | 1.601 | 60.43 | 73.34 | 66.69 | 1,582,398 |
| 2007 | 142,862,692 | 1,610,122 | 2,080,445 | -470,323 | 11.3 | 14.6 | -3.3 | 2.5 | 1.416 | 1.294 | 1.798 | 61.46 | 74.02 | 67.61 | 1,479,010 |
| 2008 | 142,742,368 | 1,713,947 | 2,075,954 | -362,007 | 12.0 | 14.5 | -2.6 | 2.5 | 1.502 | 1.372 | 1.912 | 61.92 | 74.28 | 67.99 | 1,385,600 |
| 2009 | 142,785,344 | 1,761,687 | 2,010,543 | -248,856 | 12.3 | 14.1 | -1.7 | 2.4 | 1.542 | 1.415 | 1.941 | 62.87 | 74.79 | 68.78 | 1,292,389 |
| 2010 | 142,849,472 | 1,788,948 | 2,028,516 | -239,568 | 12.5 | 14.2 | -1.7 | 1.9 | 1.567 | 1.439 | 1.983 | 63.09 | 74.88 | 68.94 | 1,186,108 |
| 2011 | 142,860,908 | 1,796,629 | 1,925,720 | -129,091 | 12.6 | 13.5 | -0.9 | 2.2 | 1.582 | 1.442 | 2.056 | 64.04 | 75.61 | 69.83 | 1,124,880 |
| 2012 | 143,056,383 | 1,902,084 | 1,906,335 | -4,251 | 13.3 | 13.3 | 0.0 | 2.0 | 1.691 | 1.541 | 2.215 | 64.56 | 75.86 | 70.24 | 1,063,982 |
| 2013 | 143,347,959 | 1,895,822 | 1,871,809 | 24,013 | 13.3 | 13.0 | 0.2 | 2.0 | 1.707 | 1.551 | 2.264 | 65.14 | 76.31 | 70.77 | 1,012,399 |
| 2014 | 143,666,931 | 1,942,683 | 1,912,347 | 30,336 | 13.3 | 13.0 | 0.3 | 17.8 | 1.750 | 1.588 | 2.318 | 65.29 | 76.49 | 70.93 | 929,963 |
| 2015 | 146,267,288 | 1,940,579 | 1,908,541 | 32,038 | 13.3 | 13.1 | 0.2 | 1.7 | 1.777 | 1.678 | 2.111 | 65.92 | 76.71 | 71.39 | 848,180 |
| 2016 | 146,544,710 | 1,888,729 | 1,891,015 | -2,286 | 12.9 | 12.9 | 0.0 | 1.8 | 1.762 | 1.672 | 2.056 | 66.50 | 77.06 | 71.87 | 836,611 |
| 2017 | 146,804,374 | 1,690,307 | 1,826,125 | -135,818 | 11.5 | 12.4 | -0.9 | 1.4 | 1.621 | 1.527 | 1.923 | 67.51 | 77.64 | 72.70 | 779,848 |
| 2018 | 146,880,432 | 1,604,344 | 1,828,910 | -224,566 | 10.9 | 12.5 | -1.6 | 0.9 | 1.579 | 1.489 | 1.870 | 67.75 | 77.81 | 72.91 | 661,045 |
| 2019 | 146,780,720 | 1,481,074 | 1,798,307 | -317,233 | 10.1 | 12.3 | -2.2 | 2.0 | 1.504 | 1.427 | 1.754 | 68.24 | 78.17 | 73.34 | 621,652 |
| 2020 | 146,170,015 | 1,436,514 | 2,138,586 | -702,072 | 9.8 | 14.6 | -4.8 | 0.6 | 1.505 | 1.433 | 1.739 | 66.49 | 76.43 | 71.54 | 553,500 |
| 2021 | 145,557,576 | 1,398,253 | 2,441,594 | -1,043,341 | 9.6 | 16.8 | -7.2 | 3.0 | 1.505 | 1.436 | 1.734 | 65.51 | 74.51 | 70.06 | 490,419 |
| 2022 | 146,424,729 | 1,304,087 | 1,898,644 | -594,557 | 8.9 | 13.0 | -4.1 | 10.0 | 1.416 | 1.36 | 1.59 | 67.60 | 77.79 | 72.76 | |
| 2023 | 146,325,519 | 1,264,354 | 1,764,618 | -500,264 | 8.6 | 12.1 | -3.5 | 2.8 | 68.04 | 78.74 | 73.41 | ||||
| 2024 | 146,150,800 | ||||||||||||||
- Russian data after 2014 includes the populations of areas annexed by Russia during the Russo-Ukrainian War that are internationally recognized as parts of Ukraine (e.g., Crimea starting in 2014). The annexation of Crimea and Sevastopol is internationally recognized only by a handful of countries like Belarus and Nicaragua. The Russian annexation of Donetsk, Kherson, Luhansk and Zaporizhzhia oblasts is internationally only recognized by Syria and North Korea.
| Urban live births | Urban deaths | Urban natural change | Urban crude birth rate (per 1,000) | Urban crude death rate (per 1,000) | Urban natural change (per 1,000) | Rural live births | Rural deaths | Rural natural change | Rural crude birth rate (per 1,000) | Rural crude death rate (per 1,000) | Rural natural change (per 1,000) | |
|---|---|---|---|---|---|---|---|---|---|---|---|---|
| 1950 | 1,171,250 | 436,792 | 734,458 | 26.1 | 9.7 | 16.4 | 1,574,747 | 594,218 | 980,529 | 27.5 | 10.4 | 17.1 |
| 1960 | 1,332,812 | 436,709 | 896,103 | 20.4 | 6.7 | 13.7 | 1,449,541 | 449,831 | 1,000,160 | 26.5 | 8.2 | 18.3 |
| 1970 | 1,205,207 | 646,129 | 559,078 | 14.8 | 7.9 | 6.9 | 698,506 | 485,054 | 213,452 | 14.3 | 10.0 | 4.3 |
| 1980 | 1,535,723 | 970,256 | 565,467 | 15.8 | 10.0 | 5.8 | 667,056 | 555,499 | 111,557 | 16.1 | 13.4 | 2.7 |
| 1990 | 1,386,247 | 1,140,613 | 245,634 | 12.7 | 10.5 | 2.2 | 602,611 | 515,380 | 87,231 | 15.5 | 13.2 | 2.3 |
| 1995 | 933,460 | 1,554,182 | −620,722 | 8.7 | 14.4 | −5.7 | 430,346 | 649,269 | −219,283 | 10.9 | 16.5 | −5.6 |
| 2000 | 886,908 | 1,564,034 | −677,126 | 8.3 | 14.6 | −6.3 | 379,892 | 661,298 | −281,406 | 9.8 | 17.1 | −7.3 |
| 2001 | 928,642 | 1,592,254 | −663,612 | 8.7 | 14.9 | −6.2 | 382,962 | 662,602 | −279,640 | 10.0 | 17.3 | −7.3 |
| 2002 | 998,056 | 1,638,822 | −640,766 | 9.4 | 15.4 | −6.0 | 398,911 | 693,450 | −294,539 | 10.5 | 18.2 | −7.7 |
| 2003 | 1,050,565 | 1,657,569 | −607,004 | 9.9 | 15.6 | −5.7 | 426,736 | 708,257 | −281,521 | 11.1 | 18.4 | −7.3 |
| 2004 | 1,074,247 | 1,606,894 | −532,647 | 10.1 | 15.2 | −5.1 | 428,230 | 688,508 | −260,278 | 11.2 | 18.1 | −6.9 |
| 2005 | 1,036,870 | 1,595,762 | −558,892 | 9.8 | 15.1 | −5.3 | 420,506 | 708,173 | −287,667 | 11.0 | 18.6 | −7.6 |
| 2006 | 1,044,540 | 1,501,245 | −456,705 | 10.0 | 14.3 | −4.3 | 435,097 | 665,458 | −230,361 | 11.4 | 17.4 | −6.0 |
| 2007 | 1,120,741 | 1,445,411 | −324,670 | 10.7 | 13.8 | −3.1 | 489,381 | 635,034 | −145,653 | 12.9 | 16.7 | −3.8 |
| 2008 | 1,194,820 | 1,443,529 | −248,709 | 11.4 | 13.8 | −2.4 | 519,127 | 632,425 | −113,298 | 13.7 | 16.7 | −3.0 |
| 2009 | 1,237,615 | 1,397,591 | −159,976 | 11.8 | 13.3 | −1.5 | 524,072 | 612,952 | −88,880 | 13.9 | 16.3 | −2.4 |
| 2010 | 1,263,893 | 1,421,734 | −157,841 | 12.0 | 13.5 | −1.5 | 520,055 | 606,782 | −81,727 | 14.0 | 16.1 | −2.1 |
| 2011 | 1,270,047 | 1,356,696 | −88,649 | 12.0 | 12.8 | −0.8 | 526,582 | 569,024 | −42,442 | 14.1 | 15.2 | −1.1 |
| 2012 | 1,355,674 | 1,353,635 | 2,039 | 12.8 | 12.8 | 0.0 | 546,410 | 552,700 | −6,290 | 14.7 | 14.8 | −0.1 |
| 2013 | 1,357,310 | 1,332,505 | 24,805 | 12.8 | 12.5 | 0.3 | 538,512 | 539,304 | −792 | 14.5 | 14.5 | −0.0 |
| 2014 | 1,394,860 | 1,362,810 | 32,050 | 12.9 | 12.6 | 0.3 | 547,823 | 549,537 | −1,714 | 14.4 | 14.5 | −0.1 |
| 2015 | 1,455,283 | 1,361,891 | 93,392 | 13.4 | 12.6 | 0.8 | 485,296 | 546,650 | −61,354 | 12.8 | 14.4 | −1.6 |
| 2016 | 1,426,591 | 1,354,944 | 71,597 | 13.1 | 12.4 | 0.7 | 462,138 | 536,071 | −73,933 | 12.2 | 14.2 | −2.0 |
| 2017 | 1,269,527 | 1,310,235 | −40,708 | 11.6 | 12.0 | −0.4 | 420,780 | 515,890 | −95,110 | 11.2 | 13.7 | −2.5 |
| 2018 | 1,205,231 | 1,317,703 | −112,472 | 11.0 | 12.0 | −1.0 | 399,113 | 511,207 | −112,094 | 10.6 | 13.6 | −3.0 |
| 2019 | 1,115,337 | 1,301,650 | −186,313 | 10.2 | 11.9 | −1.7 | 365,737 | 496,657 | −130,920 | 9.8 | 13.3 | −3.5 |
| 2020 | 1,079,887 | 1,568,773 | −488,886 | 9.9 | 14.4 | −4.5 | 356,627 | 569,813 | −213,186 | 9.6 | 15.3 | −5.7 |
| 2021 | 1,047,736 | 1,799,381 | −751,645 | 9.6 | 16.5 | −6.9 | 350,522 | 642,218 | −291,696 | 9.5 | 17.5 | −7.9 |
Current vital statistics
| Period | Live births | Deaths | Natural increase |
|---|---|---|---|
| January – July 2023 | 726,641 | 1,023,947 | −297,306 |
| January – July 2024 | 714,657 | 1,078,609 | −363,952 |
| Difference | |||
| Source: | |||
All numbers for the Russian Federation in this section do not include the Ukrainian regions of Kherson, Zaporizhzhia, Donetsk and Luhansk, which Russia annexed in September 2022 and which are currently partly under Russian military control. The annexation is internationally recognized only by Syria and North Korea.
Immigration
In 2006, in a bid to compensate for the country's demographic decline, the Russian government started simplifying immigration laws. New citizenship rules introduced in April 2014 allowing eligible citizens from former Soviet republics to obtain Russian citizenship, have gained strong interest among Russian-speaking residents of those countries (i.e. Russians, Germans, Belarusians and Ukrainians).
There are an estimated four million undocumented immigrants from the ex-Soviet states in Russia. In 2012, the Russian Federal Security Service's Border Service stated there had been an increase in undocumented migration from the Middle East and Southeast Asia (Note that these were Temporary Contract Migrants) Under legal changes made in 2012, undocumented immigrants who are caught will be banned from reentering the country for 10 years.
Since the collapse of the USSR, most immigrants have come from Ukraine, Uzbekistan, Tajikistan, Azerbaijan, Armenia, Kyrgyzstan, Moldova, Kazakhstan, Turkmenistan, Belarus, from poor areas of China, and from Vietnam and Laos.
Worker migration
Temporary migrant workers in Russia consists of about 7 million people. Most of the temporary workers come from Central Asia (mostly from Uzbekistan, Tajikistan and Kyrgyzstan), the South Caucasus (mostly from Armenia and Azerbaijan), and East Asia (mostly from poor areas of China, from Vietnam and Laos). Most of them work in the construction, cleaning and in the household industries. They primarily live in cities such as Moscow and Moscow Oblast, Saint Petersburg, Yekaterinburg, Novosibirsk, Kazan, Nijniy Novgorod, Vladivostok, Samara, Krasnodar, Ufa, Sochi, Khabarovsk, Krasnoyarsk, Chelyabinsk, Rostov on Don, Volgograd, Omsk, Tyumen, Voronezh, Perm and others. The mayor of Moscow said that Moscow cannot do without worker migrants. New laws are in place that require worker migrants to be fluent in Russian, know Russian history and laws.
Emigration
The 2022 Russian invasion of Ukraine has led to considerable emigration, with over 300,000 Russian citizens and residents are estimated to have left Russia by mid-March 2022, at least 500,000 by the end of August 2022, and an additional 400,000 by early October. The total number of political refugees, economic migrants, and conscientious objectors is thought to be more than 900,000. In addition to evading criminal prosecution for opposing the invasion, and fear of being conscripted after President Vladimir Putin's 21 September 2022 announcement of partial mobilization, those fleeing voiced reasons such as disagreement with the war, the uselessness and cruelty of the war, sympathy for Ukraine, disagreement with the political roots of the war with Ukraine, the rejection of killing, and an assessment that Russia is no longer the place for their family.
Occupied and annexed regions
Russia has encouraged or even forced people in occupied or annexed regions to become Russian citizens, a procedure known as passportization. This includes the Donetsk, Kherson, Luhansk and Zaporizhzhia oblasts of Ukraine, and South Ossetia and Abkhazia in Georgia.
Employment and income
- Unemployment, youth ages 15–24
- total: 12%. Country comparison to the world: 72nd
- male: 15.3%
- female: 16.9% (2015 est.)
Health

Russia's constitution guarantees free, universal health care for all Russian citizens, through a compulsory state health insurance program. The Ministry of Health of the Russian Federation oversees the Russian public healthcare system, and the sector employs more than two million people. Federal regions also have their own departments of health that oversee local administration. A separate private health insurance plan is needed to access private healthcare in Russia.
Russia spent 5.32% of its GDP on healthcare in 2018. Its healthcare expenditure is notably lower than other developed nations. Russia has one of the world's most female-biased sex ratios, with 0.859 males to every female, due to its high male mortality rate. In 2019, the overall life expectancy in Russia at birth was 73.2 years (68.2 years for males and 78.0 years for females), and it had a very low infant mortality rate (5 per 1,000 live births).
The principal causes of death in Russia are cardiovascular diseases. Obesity is a prevalent health issue in Russia; 61.1% of Russian adults were overweight or obese in 2016. However, Russia's historically high alcohol consumption rate is the biggest health issue in the country, as it remains one of the world's highest, despite a stark decrease in the last decade. Smoking is another health issue in the country. The country's high suicide rate, although on the decline, remains a significant social issue.
COVID-19 pandemic
Russia had one of the highest number of confirmed cases in the world. Analysis of excess deaths from official government demographic statistics, based on births and deaths and excluding migration, showed that Russia had its biggest ever annual population drop in peacetime, with the population declining by 997,000 between October 2020 and September 2021, which demographer Alexei Raksha interpreted as being primarily due to the COVID-19 pandemic.
Ethnic groups


Russia is a multinational state, with many subnational entities associated with different minorities. There are over 193 ethnic groups nationwide. In the 2021 census, nearly 71.73% of the population identified as ethnic Russians (among those stating their ethnicity), and while approximately 19% of the total population identified with various ethnic minority groups. The percentage of total Russian population that did not publicly indicate any ethnic identity in the census increased from 3.94% in 2010 to 11.27% in 2021.
According to the 2021 Russian census, the number of ethnic Russians decreased by nearly 5.43 million, from roughly 111 million people in 2010 to approximately 105.5 million in 2021. In 2010, four-fifths of Russia's population originated from West of the Ural Mountains — of which the vast majority were Slavs, with a substantial minority of Finno-Ugric and Germanic peoples. Turkic peoples form a large minority, and are spread around pockets across the vast nation. Various distinct ethnic groups also inhabit the North Caucasus. Other minorities include Mongolian peoples (Buryats and Kalmyks), the Indigenous peoples of Siberia, a historical Jewish population, and the Koryo-saram (including Sakhalin Koreans).
According to the United Nations, Russia's immigrant population is the third-largest in the world, numbering over 11.6 million in 2016; most of which are from post-Soviet states, mainly from Central Asia. There are 22 republics in Russia, who have their own ethnicities, cultures, and languages. In 12 of them in 2021, ethnic Russians constitute a minority:
| Ethnic Russian-minority regions in Russia in 2021 | |
|---|---|
| Republic | ethnic Russians (%) |
37.5% | |
1.2% | |
30.7% | |
3.3% | |
0.7% | |
19.8% | |
25.7% | |
27.5% | |
18.9% | |
32.6% | |
40.3% | |
10.1% | |
Languages

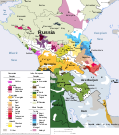
Russian is the official and the predominantly spoken language in Russia. It is the most spoken native language in Europe, the most geographically widespread language of Eurasia, as well as the world's most widely spoken Slavic language. Russian is the fifth-most used language on the Internet, and is one of two official languages aboard the International Space Station, as well as one of the six official languages of the United Nations.
Russia is a multilingual nation; approximately 100–150 minority languages are spoken across the country. According to the Russian Census of 2002, 142.6 million across the country spoke Russian, 5.3 million spoke Tatar, and 1.8 million spoke Ukrainian. The constitution allows the country's individual republics the right to establish their own state languages in addition to Russian, as well as guarantee its citizens the right to preserve their native language and to create conditions for its study and development. However, various experts have claimed Russia's linguistic diversity is rapidly declining.
Religion
Religion in Russia (2012)

Russia is a secular state by constitution, and its largest religion is Christianity. It has the world's largest Orthodox population. As of different sociological surveys on religious adherence, between 41% and over 80% of the total population of Russia adhere to the Russian Orthodox Church. Other branches of Christianity present in Russia include Catholicism (approx. 1%), Baptists, Pentecostals, Lutherans and other Protestant churches (together totalling about 0.5% of the population) and Old Believers. There is some presence of Judaism, Buddhism, and Hinduism; pagan beliefs are also present to some extent in remote areas, sometimes syncretized with one of the mainstream religions.
In 2017, a survey made by the Pew Research Center showed that 73% of Russians declared themselves as Christians—out of which 71% were Orthodox, 1% were Catholic, and 2% were Other Christians, while 15% were unaffiliated, 10% were Muslims, and 1% followed other religions. According to various reports, the proportion of Atheists in Russia is between 16% and 48% of the population.
Islam is the second-largest religion in Russia, and it is the traditional religion among most peoples of the North Caucasus, and among some Turkic peoples scattered along the Volga-Ural region. Buddhists have a sizable population in three Siberian republics: Buryatia, Tuva, and Zabaykalsky Krai, and in Kalmykia, the only region in Europe where Buddhism is the most practised religion.
Education

Russia has an adult literacy rate of 100%. It grants free education to its citizens under its constitution. The Ministry of Education of Russia is responsible for primary and secondary education, as well as vocational education; while the Ministry of Education and Science of Russia is responsible for science and higher education. Regional authorities regulate education within their jurisdictions within the prevailing framework of federal laws. Russia is among the world's most educated countries, and has the third-highest proportion of tertiary-level graduates in terms of percentage of population, at 62%. It spent roughly 4.7% of its GDP on education in 2018.
Russia has compulsory education for a duration of 11 years, exclusively for children aged 7 to 17–18. Its pre-school education system is highly developed and optional, some four-fifths of children aged 3 to 6 attend day nurseries or kindergartens. Primary school is compulsory for 11 years, starting from age 6 to 7, and leads to a basic general education certificate. An additional two or three years of schooling are required for the secondary-level certificate, and some seven-eighths of Russians continue their education past this level. Admission to an institute of higher education is selective and highly competitive: first-degree courses usually take five years. The oldest and largest universities in Russia are Moscow State University and Saint Petersburg State University. There are ten highly prestigious federal universities across the country. Russia was the world's fifth-leading destination for international students in 2019, hosting roughly 300,000.
Urbanized areas
-
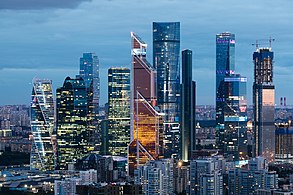 Moscow, the capital and largest city of Russia
 -
 Saint Petersburg, the cultural capital and the second-largest city
 -
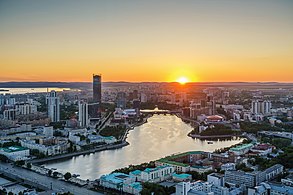 Yekaterinburg, the fourth-largest city in the country.
Russia is one of the world's most urbanized countries, with roughly 75% of its total population living in urban areas. Moscow, the capital and largest city, has a population estimated at 12.4 million residents within the city limits, while over 17 million residents in the urban area, and over 20 million residents in the metropolitan area. Moscow is among the world's largest cities, being the most populous city entirely within Europe, the most populous urban area in Europe, the most populous metropolitan area in Europe, and also the largest city by land area on the European continent. Saint Petersburg, the cultural capital, is the second-largest city, with a population of roughly 5.4 million inhabitants. Other major urban areas are Yekaterinburg, Novosibirsk, Kazan, Nizhny Novgorod, and Chelyabinsk.
Largest cities or towns in Russia
2024 estimate | |||||||||
|---|---|---|---|---|---|---|---|---|---|
| Rank | Name | Federal subject | Pop. | Rank | Name | Federal subject | Pop. | ||
 Moscow  Saint Petersburg |
1 | Moscow | Moscow | 13,149,803 | 11 | Rostov-on-Don | Rostov Oblast | 1,140,487 | 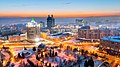 Novosibirsk  Yekaterinburg |
| 2 | Saint Petersburg | Saint Petersburg | 5,597,763 | 12 | Krasnodar | Krasnodar Krai | 1,138,654 | ||
| 3 | Novosibirsk | Novosibirsk Oblast | 1,633,851 | 13 | Omsk | Omsk Oblast | 1,104,485 | ||
| 4 | Yekaterinburg | Sverdlovsk Oblast | 1,536,183 | 14 | Voronezh | Voronezh Oblast | 1,046,425 | ||
| 5 | Kazan | Tatarstan | 1,318,604 | 15 | Perm | Perm Krai | 1,026,908 | ||
| 6 | Krasnoyarsk | Krasnoyarsk Krai | 1,205,473 | 16 | Volgograd | Volgograd Oblast | 1,018,898 | ||
| 7 | Nizhny Novgorod | Nizhny Novgorod Oblast | 1,204,985 | 17 | Saratov | Saratov Oblast | 887,365 | ||
| 8 | Chelyabinsk | Chelyabinsk Oblast | 1,177,058 | 18 | Tyumen | Tyumen Oblast | 861,098 | ||
| 9 | Ufa | Bashkortostan | 1,163,304 | 19 | Tolyatti | Samara Oblast | 667,956 | ||
| 10 | Samara | Samara Oblast | 1,158,952 | 20 | Makhachkala | Dagestan | 622,091 | ||
See also
- Demographic history of Russia
- Demographics of Siberia
- Demographic crisis of Russia
- List of federal subjects of Russia by total fertility rate
- List of federal subjects of Russia by life expectancy
- Genetic studies on Russians
- Health in Russia
- Indigenous small-numbered peoples of the North, Siberia and the Far East
- Russian cross
- Russian nationality law
Census information:
- Soviet Census
- Russian Empire Census (1897)
- Russian Census (2002)
- Russian Census (2010)
- Russian Census (2021)
- List of cities and towns in Russia by population
Notes
- 11.27% of the total Russian population did not declare an ethnic affiliation in the census, so these figures should be treated with caution.
- In fertility rates, 2.1 and above is a stable population and has been marked blue, 2 and below leads to an aging population and the result is that the population decreases.
- Including Old Believers (0.2%), Protestantism (0.2%), and Catholicism (0.1%).
- The Sreda Arena Atlas 2012 did not count the populations of two Muslim-majority federal subjects of Russia, namely Chechnya and Ingushetia, which together had a population of nearly 2 million, thus the proportion of Muslims may be slightly underestimated.
- The category included Rodnovers accounting for 44%, Hinduists accounting for 0.1%; pagan religions and Siberian Tengrists and shamans account for the rest.
- Including Judaism (0.1%) and other unspecified religions.
References
- "Численность населения России на 2024: ежедневный счетчик". Инфляцио.РУ (in Russian). Retrieved 16 June 2024.
- "Население России за год сократилось на 555 тыс. человек". РБК (in Russian). 1 February 2023. Retrieved 11 September 2024.
- "Birth rate, mortality rate, natural increase, marriage rate, divorce rate for January to December 2023". ROSSTAT. Archived from the original on 17 February 2024. Retrieved 17 February 2024.
- ^ "Демографический ежегодник России" [The Demographic Yearbook of Russia] (in Russian). Federal State Statistics Service of Russia (Rosstat). Retrieved 1 June 2022.
- ^ "Russia Demographics 2020 (Population, Age, Sex, Trends) – Worldometer". www.worldometers.info.
- "Национальный состав населения". Federal State Statistics Service. Retrieved 30 December 2022.
- "5 Million Fewer Than in 2010, Ethnic Russians Make Up Only 72 Percent of Russia's Population". Eurasia Daily Monitor. Vol. 20, no. 6. The Jamestown Foundation. 10 January 2023. Archived from the original on 25 February 2023.
And, in turn, this decline means that the share of that country's population identifying as ethnic Russian fell from 77.71 percent in the 2010 census to 71.73 percent in the current one..
- "Russia Population 0 to 1800 – Our World in Data". www.ourworldindata.org.
- "RUSSIA: historical demographical data of the whole country". Populstat.info. Archived from the original on 7 July 2017. Retrieved 6 July 2017.
- Оценка численности постоянного населения на 1 января 2020 года и в среднем за 2019 год [Preliminary estimated population as of 1 January 2020 and on the average for 2019] (XLS). Rosstat (in Russian).
- "Population of Russia 2022 | Religion in Russia | Find Easy". Findeasy.in. 3 May 2021. Retrieved 28 February 2022.
- Russian Federal State Statistics Service. Всероссийская перепись населения 2020 года. Том 1 [2020 All-Russian Population Census, vol. 1] (XLS) (in Russian). Federal State Statistics Service.
- "Population density (people per sq. km of land area)". The World Bank. Retrieved 16 June 2021.
- Koehn, Jodi (5 February 2001). "Russia's Demographic Crisis". Kennan Institute. Woodrow Wilson International Center for Scholars. Retrieved 18 July 2021.
- ^ "Russia". The World Factbook. 7 February 2020.
- Foltynova, Kristyna (19 June 2020). "Migrants Welcome: Is Russia Trying To Solve Its Demographic Crisis By Attracting Foreigners?". Radio Free Europe/Radio Liberty. Retrieved 9 July 2021.
Russia has been trying to boost fertility rates and reduce death rates for several years now. Special programs for families have been implemented, anti-tobacco campaigns have been organized, and raising the legal age to buy alcohol was considered. However, perhaps the most successful strategy so far has been attracting migrants, whose arrival helps Russia to compensate population losses.
- Saver, Pjotr (13 October 2021). "Russia's population undergoes largest ever peacetime decline, analysis shows". The Guardian. Retrieved 17 November 2021.
Russia's natural population has undergone its largest peacetime decline in recorded history over the last 12 months...
- ^ Curtis, Glenn E. (1998). "Russia – Ethnic Composition". Washington, D.C.: Federal Research Division of the Library of Congress. Retrieved 27 January 2022.
-
- "Russia's population nightmare is going to get even worse". The Economist. 4 March 2023. Archived from the original on 10 April 2023.
The decline was largest among ethnic Russians, whose number, the census of 2021 said, fell by 5.4m in 2010–21. Their share of the population fell from 78% to 72%.
- "5 Million Fewer Than in 2010, Ethnic Russians Make Up Only 72 Percent of Russia's Population". Eurasia Daily Monitor. Vol. 20, no. 6. The Jamestown Foundation. 10 January 2023. Archived from the original on 25 February 2023.
And, in turn, this decline means that the share of that country's population identifying as ethnic Russian fell from 77.71 percent in the 2010 census to 71.73 percent in the current one..
- Sidorov, Harun (7 January 2023). ""Русский мир" Путина и "кот Шредингера"" [Putin's "Russian World" and "Schrödinger's cat"]. idelreal.org (in Russian). Archived from the original on 7 January 2023.
- "Национальный состав населения" (in Russian). Federal State Statistics Service. Retrieved 30 December 2022.
- "Russia's population nightmare is going to get even worse". The Economist. 4 March 2023. Archived from the original on 10 April 2023.
- ^ Kirk, Ashley (21 January 2016). "Mapped: Which country has the most immigrants?". The Daily Telegraph. Archived from the original on 10 January 2022. Retrieved 30 June 2021.
- ^ "Росстат — Новости Росстата". rosstat.gov.ru.
- "Russia Population 2018", World Population Review
- "Russia's decaying villages". Al Jazeera. 2 May 2014.
- "Интерактивная витрина". cbsd.gks.ru. Archived from the original on 30 January 2017. Retrieved 16 September 2017.
- "Миграция в России, предварительные итоги 2021 года (Migration in Russia, preliminary results of 2021)". Институт демографии НИУ ВШЭ имени А.Г. Вишневского (Institute of Demography, National Research University A.G. Vishnevsky). 2022. Retrieved 26 March 2022.
- "Natural population decrease in Russia down by 21% in Jan 2022 vs Jan 2021, but twice higher than in Jan 2020 – Rosstat". Interfax News Agency. 6 March 2022. Retrieved 26 March 2022.
- ^ Sauer, Pjotr (13 October 2021). "Russia's population undergoes largest ever peacetime decline". The Guardian.
- "Natural population decrease in Russia down by 21% in Jan 2022 vs Jan 2021, but twice higher than in Jan 2020 – Rosstat". Interfax News Agency. 6 March 2022.
- "Russia stares into population abyss as Putin sends its young men to die". The Telegraph. 26 February 2023.
- Cocco, Federica; Ivanonva, Polina (4 April 2022). "Ukraine war threatens to deepen Russia's demographic crisis". Financial Times. London. Archived from the original on 10 December 2022. Retrieved 6 October 2022.
- Goble, Paul (18 August 2022). "Russia's Demographic Collapse Is Accelerating". Eurasia Daily Monitor. 19 (127). Washington, D.C.: Jamestown Foundation.
- ^ "Russia's population nightmare is going to get even worse". The Economist. 4 March 2023.
- "World Population Prospects 2022, Standard Projections, Compact File, Variant tab, Total Population, as of 1 January column". United Nations Department of Economic and Social Affairs, Population Division. 2022.
- "Russia's Population Could Fall to 130Mln by 2046 – Rosstat". The Moscow Times. 12 January 2024.
- ^ Ben Aris (4 May 2022). "Russian fertility rates fall to record lows on the back of a deteriorating economy and sanctions pressure". BNE Intellinews. Berlin.
- ^ Max Roser (2014), "Total Fertility Rate around the world over the last centuries", Our World in Data, Gapminder Foundation
- ^ "А. Г. Рашин. Население России за 100 лет (1811—1913 гг.). Статистические очерки. Раздел первый. Масштабы и темпы динамики численности населения России за 1811—1913 гг. Глава первая. Динамика общей численности населения России за 1811—1913 гг. страница 38" (PDF).
- "UNSD — Demographic and Social Statistics". unstats.un.org. Retrieved 10 May 2023.
- ^ E.Andreev, L.Darski, T. Kharkova "Histoire démographique de la Russie. 1927–1959"
- "Goskomstat". Goskomstat. Archived from the original on 12 April 2008. Retrieved 14 May 2011.
- "Демография". Gks.ru. Archived from the original on 4 February 2014. Retrieved 21 June 2015.
- "Каталог публикаций::Федеральная служба государственной статистики". Gks.ru. 8 May 2010. Archived from the original on 21 December 2018. Retrieved 4 June 2013.
- "Численность населения". Gks.ru. Archived from the original (XLS) on 23 February 2017. Retrieved 1 September 2017.
- "ЕМИСС – Число прерываний беременности". Fedstat.ru. Archived from the original on 24 September 2015. Retrieved 21 June 2015.
- "The Demographic Yearbook of Russia 2019" (PDF). Retrieved 28 February 2022.
- Population 2020 Archived 26 March 2020 at the Wayback Machine
- "Archived copy". Archived from the original on 23 May 2020. Retrieved 15 May 2020.
{{cite web}}: CS1 maint: archived copy as title (link) - "fedstat.ru". Retrieved 22 September 2023.
- "showdata.gks.ru".
- stastistics Russia, de jure population of Russia as of January 1, visited September 30, 2023
- Lomsadze, Giorgi (23 April 2014). "The Caucasus Concerned over Born-Again Russians". Eurasianet.org. Retrieved 1 September 2017 – via EurasiaNet.
- "Uzbekistan: Minorities Taking Advantage of New Russian Citizenship Rules". EurasiaNet.org. Retrieved 21 June 2015.
- "Новости NEWSru.com :: ФМС: в РФ нелегально работают 3 млн трудовых мигрантов, остальные 4 млн "халтурят" с налогами". Newsru.com. 23 November 2010. Retrieved 14 May 2011.
- "Russia reports surge in undocumented migration from Asia". Indian Express. Retrieved 22 August 2016.
- "Illegal immigrants can be barred from Russia for 5–10 years". The Voice of Russia. Archived from the original on 10 July 2012. Retrieved 6 April 2012.
- "Russia closed for immigration?". Russia. Archived from the original on 12 July 2012. Retrieved 6 April 2012.
- "ФМС России". fms.gov.ru. Archived from the original on 16 March 2015. Retrieved 25 April 2019.
- Ebel, Francesca; Ilyushina, Mary (13 February 2023). "Russians abandon wartime Russia in historic exodus". Washington Post. Retrieved 13 February 2023.
- Kantchev, Georgi; Gershkovich, Evan; Chernova, Yuliya (10 April 2022). "Fleeing Putin, Thousands of Educated Russians Are Moving Abroad". The Wall Street Journal. Archived from the original on 12 April 2022. Retrieved 12 April 2022.
- Demytrie, Rayhan (13 March 2022). "Russia faces brain drain as thousands flee abroad". BBC News. Tbilisi, Georgia. Archived from the original on 14 March 2022. Retrieved 6 April 2022.
- Bershidsky, Leonid (15 March 2022). "Russia's Brain Drain Becomes a Stampede for the Exits". Bloomberg. Archived from the original on 16 March 2022. Retrieved 4 April 2022.
- "Russia's war migrants find mixed reception in Georgia". Japan Times. 4 April 2022. Archived from the original on 10 April 2022. Retrieved 10 April 2022.
- "Who are the Russians leaving their country?". Deutsche Welle. 5 April 2022. Archived from the original on 7 April 2022. Retrieved 10 April 2022.
- Watson, Ivan; Lomashvili, Masho; McCarthy, Simone; Lister, Tim; Pavlova, Uliana (23 September 2022). "Traffic jams and desperation at the border as Russians flee Putin's 'partial mobilization'". CNN. Archived from the original on 24 September 2022. Retrieved 24 September 2022.
- "Forced to fight your own people: How Russia is weaponizing passports", Politico, 1 January 2023
- "Human Rights in the Occupied Territories of Georgia", Organization for Security and Co-operation in Europe (OSCE), 18 October 2010
- Morton, Elise (25 May 2018). "Russian rivieia: from Soviet sanatoriums to lush gardens, your walking guide to seaside Sochi". Calvert 22 Foundation. Retrieved 7 January 2022.
First intended for the treatment of metalworkers, Metallurg combines elements of baroque and neoclassical architecture, and is surrounded by lavish gardens.
- Cook, Linda (February 2015). "Constraints on Universal Health Care in the Russian Federation" (PDF). United Nations Research Institute for Social Development. Geneva: United Nations. Retrieved 3 January 2022.
Russian citizens have a constitutional right to free health care...
- "Healthcare in Russia: the Russian healthcare system explained". Expatica. 8 January 2021. Retrieved 21 April 2021.
- "Current health expenditure (% of GDP) – Russian Federation". World Bank. Retrieved 21 April 2021.
- Reshetnikov, Vladimir; Arsentyev, Evgeny; Bolevich, Sergey; Timofeyev, Yuriy; Jakovljević, Mihajlo (24 May 2019). "Analysis of the Financing of Russian Health Care over the Past 100 Years". International Journal of Environmental Research and Public Health. 16 (10): 1848. doi:10.3390/ijerph16101848. PMC 6571548. PMID 31137705.
- Nuwer, Rachel (17 February 2014). "Why Russian Men Don't Live as Long". The New York Times. Retrieved 7 January 2022.
Russia's life expectancy is exceptionally low compared with that in other developed countries. While American men have a 1-in-11 chance of dying before their 55th birthday, in Russia the odds are 1 in 4.
- "Life expectancy and Healthy life expectancy, data by country". World Health Organization. 2020. Retrieved 19 April 2021.
- "Mortality rate, infant (per 1,000 live births) – Russian Federation". World Bank. Retrieved 21 April 2021.
- Lakunchykova, Olena; Averina, Maria; Wilsgaard, Tom; Watkins, Hugh; Malyutina, Sofia; Ragino, Yulia; Keogh, Ruth H; Kudryavtsev, Alexander V; Govorun, Vadim; Cook, Sarah; Schirmer, Henrik; Eggen, Anne Elise; Hopstock, Laila Arnesdatter; Leon, David A (2020). "Why does Russia have such high cardiovascular mortality rates? Comparisons of blood-based biomarkers with Norway implicate non-ischaemic cardiac damage". Journal of Epidemiology and Community Health. 74 (9): 698–704. doi:10.1136/jech-2020-213885. PMC 7577103. PMID 32414935.
- Ritchie, Hannah; Roser, Max (11 August 2017). "Obesity". Our World in Data. Retrieved 21 April 2021.
- McKee, Martin (1 November 1999). "Alcohol in Russia". Alcohol and Alcoholism. 34 (6): 824–829. doi:10.1093/alcalc/34.6.824. PMID 10659717.
- Fedun, Stan (25 September 2013). "How Alcohol Conquered Russia". The Atlantic. Retrieved 30 December 2021.
Today, according to the World Health Organization, one-in-five men in the Russian Federation die due to alcohol-related causes, compared with 6.2 percent of all men globally. In her 2000 article "First Steps: AA and Alcoholism in Russia," Patricia Critchlow estimated that some 20 million Russians are alcoholics in a nation of just 144 million.
- The Lancet (5 October 2019). "Russia's alcohol policy: a continuing success story". The Lancet. 394 (10205): 1205. doi:10.1016/S0140-6736(19)32265-2. PMID 31591968.
Russians are officially drinking less and, as a consequence, are living longer than ever before...Russians are still far from being teetotal: a pure ethanol per capita consumption of 11·7 L, reported in 2016, means consumption is still one of the highest worldwide, and efforts to reduce it further are required.
- Shkolnikov, Vladimir M.; Churilova, Elena; Jdanov, Dmitry A.; Shalnova, Svetlana A.; Nilssen, Odd; Kudryavtsev, Alexander; Cook, Sarah; Malyutina, Sofia; McKee, Martin; Leon, David A. (23 March 2020). "Time trends in smoking in Russia in the light of recent tobacco control measures: synthesis of evidence from multiple sources". BMC Public Health. 20 (378): 378. doi:10.1186/s12889-020-08464-4. PMC 7092419. PMID 32293365.
The prevalence of smoking among Russian men has been very high for many years. The WHO Global Adult Tobacco Survey (GATS) found that, in the 2000s, it was among the highest in the world with Russia having the world's second-largest tobacco market by volume of sales in 2014...
- "Suicide mortality rate (per 100,000 population) – Russian Federation". World Bank. Retrieved 3 January 2022.
- "Preventing suicide: Russian Federation adapts WHO self-harm monitoring tool". World Health Organization. 9 October 2020. Archived from the original on 8 April 2022. Retrieved 3 January 2022.
The Russian Federation is one of the European Region countries where suicide remains a significant cause of death and disease burden.
- "Национальный состав населения" (in Russian). Federal State Statistics Service. Retrieved 30 December 2022.
-
- "Russia's population nightmare is going to get even worse". The Economist. 4 March 2023. Archived from the original on 10 April 2023.
The decline was largest among ethnic Russians, whose number, the census of 2021 said, fell by 5.4m in 2010–21. Their share of the population fell from 78% to 72%.
- "5 Million Fewer Than in 2010, Ethnic Russians Make Up Only 72 Percent of Russia's Population". Eurasia Daily Monitor. Vol. 20, no. 6. The Jamestown Foundation. 10 January 2023. Archived from the original on 25 February 2023.
And, in turn, this decline means that the share of that country's population identifying as ethnic Russian fell from 77.71 percent in the 2010 census to 71.73 percent in the current one..
- Sidorov, Harun (7 January 2023). ""Русский мир" Путина и "кот Шредингера"" [Putin's "Russian World" and "Schrödinger's cat"]. idelreal.org (in Russian). Archived from the original on 7 January 2023.
- "Национальный состав населения" (in Russian). Federal State Statistics Service. Retrieved 30 December 2022.
- "Russia's population nightmare is going to get even worse". The Economist. 4 March 2023. Archived from the original on 10 April 2023.
- Sidorov, Harun (7 January 2023). ""Русский мир" Путина и "кот Шредингера"" [Putin's "Russian World" and "Schrödinger's cat"]. idelreal.org (in Russian). Archived from the original on 7 January 2023.
...одним из главных победителей прошедшей переписи стала группа, увеличившая свою численность с 5 629 429 человек в 2010 году до 10 965 330 человек в 2021 году и соответственно долю в населении с 3,94% до 11,27%. Эта группа — лица, не указавшие свою национальность.
['...one of the main winners of the last census was a group that increased its number from 5,629,429 people in 2010 to 10,965,330 people in 2021 and, accordingly, its share in the population from 3.94% to 11.27%. This group consists of people who have not indicated their nationality.'] -
- Sidorov, Harun (7 January 2023). ""Русский мир" Путина и "кот Шредингера"" [Putin's "Russian World" and "Schrödinger's cat"]. idelreal.org (in Russian). Archived from the original on 7 January 2023.
- "5 Million Fewer Than in 2010, Ethnic Russians Make Up Only 72 Percent of Russia's Population". Eurasia Daily Monitor. Vol. 20, no. 6. The Jamestown Foundation. 10 January 2023. Archived from the original on 25 February 2023.
- "Russia's population nightmare is going to get even worse". The Economist. 4 March 2023. Archived from the original on 10 April 2023.
The decline was largest among ethnic Russians, whose number, the census of 2021 said, fell by 5.4m in 2010–21. Their share of the population fell from 78% to 72%.
- "Russia – The Indo-European Group". Encyclopedia Britannica. Retrieved 18 July 2021.
East Slavs—mainly Russians but including some Ukrainians and Belarusians—constitute more than four-fifths of the total population and are prevalent throughout the country.
- Kowalev, Viktor; Neznaika, Pavel (2000). "Power and Ethnicity in the Finno-Ugric Republics of the Russian Federation: The Examples of Komi, Mordovia, and Udmurtia". International Journal of Political Economy. 30 (3). Taylor & Francis: 81–100. doi:10.1080/08911916.2000.11644017. JSTOR 41103741. S2CID 152467776.
- Bartlett, Roger (July 1995). "The Russian Germans and Their Neighbours". The Slavonic and East European Review. 73 (3). Modern Humanities Research Association: 499–504. JSTOR 4211864.
- Hostler, Charles W. (1958). "The Turks and Soviet Central Asia". The Middle East Journal. 12 (3). Middle East Institute: 261–269. JSTOR 4323021.
- Sagramoso, Domitilla (2007). "Violence and Conflict in the Russian North Caucasus". International Affairs. 83 (4). Oxford University Press: 681–705. doi:10.1111/j.1468-2346.2007.00647.x. JSTOR 4541805. S2CID 153552543.
- Zhukovskaya, Natalya L. (13 September 2007). "Religion and ethnicity in eastern Russia, republic of Buryatia: A panorama of the 1990s". Central Asian Survey. 14 (1). Taylor & Francis: 25–42. doi:10.1080/02634939508400890.
- Szilagyi, Patricia (26 May 2021). "The only Buddhist region in Europe". DW News. Deutsche Welle. Retrieved 11 August 2022.
- Vinokurova, Uliana (December 2018). "Indigenous Peoples of Siberia and the Challenges of the Twenty-First Century". Sibirica. 17 (3). Berghahn Books: 3–15. doi:10.3167/sib.2018.170302. S2CID 149567661.
- Jack, Victor (4 July 2022). "Russia's Jews fear resurgent anti-Semitism amid Ukraine war". Politico. Retrieved 11 August 2022.
- Park, Hyun-gwi (2013). "The Migration Regime among Koreans in the Russian Far East". Inner Asia. 15 (1). Brill: 77–99. doi:10.1163/22105018-90000056. JSTOR 23615082.
- Ragozin, Leonid (14 March 2017). "Russia Wants Immigrants the World Doesn't". Bloomberg L.P. Retrieved 5 July 2023.
- Laub, Zachary (7 February 2014). "Background Briefing: Why is Russia's North Caucasus region unstable?". PBS NewsHour. PBS. Retrieved 5 January 2022.
With 10 million inhabitants, the North Caucasus Federal District is the smallest of Russia's eight federal districts, and the only one in which ethnic Russians do not constitute a majority. Some forty ethnic groups reside in the region, making it one of Russia's most diverse.
- Lazarev, Vladimir; Pravikova, Ludmila. The North Caucasus Bilingualism and Language Identity (PDF). Pyatigorsk State Linguistic University. p. 1325.
The North Caucasus, inhabited by more than 100 of autochthonous and allochthonous peoples, including Russians, is a unique locus for conducting a large-scale research in the area of bilingualism and multilingualism.
- ^ "Russian". University of Toronto. Retrieved 9 July 2021.
Russian is the most widespread of the Slavic languages and the largest native language in Europe. Of great political importance, it is one of the official languages of the United Nations – making it a natural area of study for those interested in geopolitics.
- "Usage statistics of content languages for websites". W3Techs. Retrieved 17 July 2021.
- Wakata, Koichi. "My Long Mission in Space". JAXA. Retrieved 18 July 2021.
The official languages on the ISS are English and Russian, and when I was speaking with the Flight Control Room at JAXA's Tsukuba Space Center during ISS systems and payload operations, I was required to speak in either English or Russian.
- Iryna, Ulasiuk (2011). "Legal protection of linguistic diversity in Russia: past and present". Journal of Multilingual and Multicultural Development. 32 (1). European University Institute: 71–83. doi:10.1080/01434632.2010.536237. ISSN 0143-4632. S2CID 145612470.
Russia is unique in its size and ethnic composition. There is a further linguistic complexity of more than 150 co-existing languages.
- "Russia – Ethnic groups and languages". Encyclopedia Britannica. Retrieved 8 November 2020.
Although ethnic Russians comprise more than four-fifths of the country's total population, Russia is a diverse, multiethnic society. More than 120 ethnic groups, many with their own national territories, speaking some 100 languages live within Russia's borders.
- "Russian Census of 2002". 4.3. Population by nationalities and knowledge of Russian; 4.4. Spreading of knowledge of languages (except Russian). Rosstat. Archived from the original on 19 July 2011. Retrieved 16 January 2008.
- "Chapter 3. The Federal Structure". Constitution of Russia. Retrieved 27 December 2007.
2. The Republics shall have the right to establish their own state languages. In the bodies of state authority and local self-government, state institutions of the Republics they shall be used together with the state language of the Russian Federation. 3. The Russian Federation shall guarantee to all of its peoples the right to preserve their native language and to create conditions for its study and development.
- Jankiewicz, Szymon; Knyaginina, Nadezhda; Prina, Federic (13 March 2020). "Linguistic rights and education in the republics of the Russian Federation: towards unity through uniformity" (PDF). Review of Central and East European Law. 45 (1). Brill: 59–91. doi:10.1163/15730352-bja10003. ISSN 0925-9880. S2CID 216273023.
- Bondarenko, Dmitry V.; Nasonkin, Vladimir V.; Shagieva, Rozalina V.; Kiyanova, Olga N.; Barabanova, Svetlana V. (2018). "Linguistic Diversity In Russia Is A Threat To Sovereignty Or A Condition Of Cohesion?" (PDF). Modern Journal of Language Teaching Methods. 8 (5): 166–182. ISSN 2251-6204.
- ^ "Арена: Атлас религий и национальностей" [Arena: Atlas of Religions and Nationalities] (PDF). Среда (Sreda). 2012. See also the results' main interactive mapping and the static mappings: "Religions in Russia by federal subject" (Map). Ogonek. 34 (5243). 27 August 2012. Archived from the original on 21 April 2017. The Sreda Arena Atlas was realised in cooperation with the All-Russia Population Census 2010 (Всероссийской переписи населения 2010) and the Russian Ministry of Justice (Минюста РФ).
- "Religious Belief and National Belonging in Central and Eastern Europe". Pew Research Center's Religion & Public Life Project. 10 May 2017.
- "Orthodox Christianity in the 21st Century". Pew Research Center's Religion & Public Life Project. 10 November 2017.
- There is no official census of religion in Russia, and estimates are based on surveys only. In August 2012, ARENA determined that about 46.8% of Russians are Christians (including Orthodox, Catholic, Protestant, and non-denominational), which is slightly less than an absolute 50%+ majority. However, later that year the Levada Center Archived 31 December 2012 at the Wayback Machine determined that 76% of Russians are Christians, and in June 2013 the Public Opinion Foundation determined that 65% of Russians are Christians. These findings are in line with Pew's 2010 survey, which determined that 73.3% of Russians are Christians, with VTSIOM Archived 29 September 2020 at the Wayback Machine's 2010 survey (≈77% Christian), and with Ipsos MORI Archived 17 January 2013 at the Wayback Machine's 2011 survey (69%).
- Верю — не верю. "Ogonek", No. 34 (5243), 27 August 2012. Retrieved 24 September 2012.
- Опубликована подробная сравнительная статистика религиозности в России и Польше (in Russian). Archived from the original on 2 December 2015. Retrieved 6 January 2016.
- "Arena: Atlas of Religions and Nationalities in Russia". Sreda, 2012.
- 2012 Arena Atlas Religion Maps. Ogonek, No. 34 (5243), 27 August 2012. Retrieved 21 April 2017. Archived.
- "Religious Belief and National Belonging in Central and Eastern Europe". Pew Research Center. 10 May 2017. Retrieved 9 September 2017.
- Zuckerman, P. (2005). "Atheism: Contemporary Rates and Patterns". In Martin, Michael (ed.). The Cambridge Companion to Atheism. Cambridge University Press.
- "Russian Federation". Europe: Belarus, Russian Federation and Ukraine. World and Its Peoples. Marshall Cavendish. 2010. p. 1387. ISBN 978-0-7614-7900-0.
- Jardine, Bradley (4 January 2017). "Russia's Buddhist Republic". The Diplomat. Retrieved 4 June 2021.
Kalmykia is Europe's only Buddhist Republic. The region's people are descended from the nomads who wandered the vast Central Asian steppes under Genghis Khan's empire. When the empire began to collapse, the Kalmykians migrated toward the Caspian Sea settling what is today called Kalmykia – Kalmyk means "remnant" in the local language.
- "Lomonosov Moscow State University". QS World University Rankings. Retrieved 28 June 2021.
...Considered one the most prestigious universities in Russia, It houses the tallest educational building in the world, and hosts more than 47,000 students, welcoming 4,000 international students every year.
- "Literacy rate, adult total (% of people ages 15 and above) – Russian Federation". World Bank. Retrieved 21 January 2022.
- ^ Oleg, Kouptsov (1997). Mutual recognition of qualifications: the Russian Federation and the other European countries. UNESCO-CEPES. Bucharest: UNESCO. p. 25. ISBN 929-0-69146-8.
The citizens of the Russian Federation have the right to free primary education, basic and secondary general education, and to vocational education; and on a competitive basis, to free non-university and university level higher educational and to postgraduate education
- ^ "Education system Russia" (PDF). 3. The Hague: Nuffic. October 2019. Archived from the original (PDF) on 26 July 2021. Retrieved 26 July 2021.
- Population with tertiary education. OECD. 2022. doi:10.1787/0b8f90e9-en. Retrieved 21 January 2022.
- "Government expenditure on education, total (% of GDP) – Russian Federation". World Bank. Retrieved 4 January 2022.
- Taratukhina, Maria S.; Polyakova, Marina N.; Berezina, Tatyana A.; Notkina, Nina A.; Sheraizina, Roza M.; Borovkov, Mihail I. (2006). "Early childhood care and education in the Russian Federation". UNESCO. Retrieved 4 January 2022.
- "Russia – Education". Encyclopedia Britannica. Retrieved 30 July 2021.
- Ridder-Symoens, Hilde de (1996). History of the University in Europe: Volume 2, Universities in Early Modern Europe (1500–1800). A History of the University in Europe. Cambridge University Press. pp. 80–89. ISBN 978-0-521-36106-4.
- "Global Flow of Tertiary-Level Students". UNESCO. Retrieved 4 January 2022.
- "RUSSIA: Central'nyj Federal'nyj Okrug – Central Federal District". City Population.de. 8 August 2020. Retrieved 1 September 2020.
- ^ "Demographia World Urban Areas" (PDF). Demographia. Retrieved 22 July 2020.
- ^ Alexander Akishin (17 August 2017). "A 3-Hour Commute: A Close Look At Moscow The Megapolis". Strelka Mag. Archived from the original on 17 April 2021. Retrieved 23 May 2020.
- "Moscow, a City Undergoing Transformation". Planète Énergies. 11 September 2017. Retrieved 27 May 2020.
- "RUSSIA: Severo-Zapadnyj Federal'nyj Okrug: Northwestern Federal District". City Population.de. 8 August 2020. Retrieved 24 October 2020.
- "Численность постоянного населения Российской Федерации по муниципальным образованиям на 1 января 2024 года". Federal State Statistics Service. Retrieved 30 April 2024.
Further reading
- Gavrilova N.S., Gavrilov L.A. Aging Populations: Russia/Eastern Europe. In: P. Uhlenberg (Editor), International Handbook of the Demography of Aging, New York: Springer-Verlag, 2009, pp. 113–131.
- Gavrilova N.S., Semyonova V.G., Dubrovina E., Evdokushkina G.N., Ivanova A.E., Gavrilov L.A. Russian Mortality Crisis and the Quality of Vital Statistics. Population Research and Policy Review, 2008, 27: 551–574.
- Gavrilova, N.S., Gavrilov, L.A., Semyonova, V.G., Evdokushkina, G.N., Ivanova, A.E. 2005. Patterns of violent crime in Russia. In: Pridemore, W.A. (ed.). Ruling Russia: Law, Crime, and Justice in a Changing Society. Boulder, Colorado: Rowman & Littlefield Publ., Inc, 117–145
- Gavrilova, N.S., Semyonova, V.G., Evdokushkina G.N., Gavrilov, L.A. The response of violent mortality to economic crisis in Russia. Population Research and Policy Review, 2000, 19: 397–419.
- Kamenskii, Aleksander (2014). "Do we know the composition of the 18th century Russian society?". Cahiers du Monde Russe. 55 (1–2): 135–148. doi:10.4000/monderusse.7989. ISBN 9782713224409. ISSN 1777-5388.
External links
- Igor Beloborodov, Demographic situation in Russia in 1992–2010 Archived 14 October 2022 at the Wayback Machine (report at the Moscow Demographic Summit – June 2011)
- Nicholas Eberstadt, Russia's Peacetime Demographic Crisis: Dimensions, Causes, Implications (National Bureau of Asian Research Project Report, May 2010)
- Edited by Julie DaVanzo, Gwen Farnsworth Russia's Demographic "Crisis" 1996 RAND ISBN 0-8330-2446-9
- Jessica Griffith The Regional Consequences of Russia's Demographic Crisis Archived 12 April 2012 at the Wayback Machine University of Leicester
- Results of population policy and current demographic situation (2008)
- Interactive statistics for all countries, site of United States Census Bureau.
- 2009 World Population Data Sheet Archived 8 June 2017 at the Wayback Machine by the Population Reference Bureau
- Population density and distribution maps (text is in Russian; the topmost map shows population density based on 1996 data)
- Ethnic groups of Russia
- Problems with mortality data in Russia
- V. Borisov "Demographic situation in Russia and the role of mortality in reproduction of population" Archived 14 October 2022 at the Wayback Machine, 2005 (in English)
- Choice between mass migration and birth rate increase as possible solutions of depopulation problem in Russia (in Russian)